
Read Nginx traffic with its evidence in context.
All in Term's Nginx workspace brings request analysis, error inspection, virtual hosts and configuration into the connected server workflow. Use it to investigate a traffic spike or an upstream failure while keeping the logged population, selected date and source coverage visible.
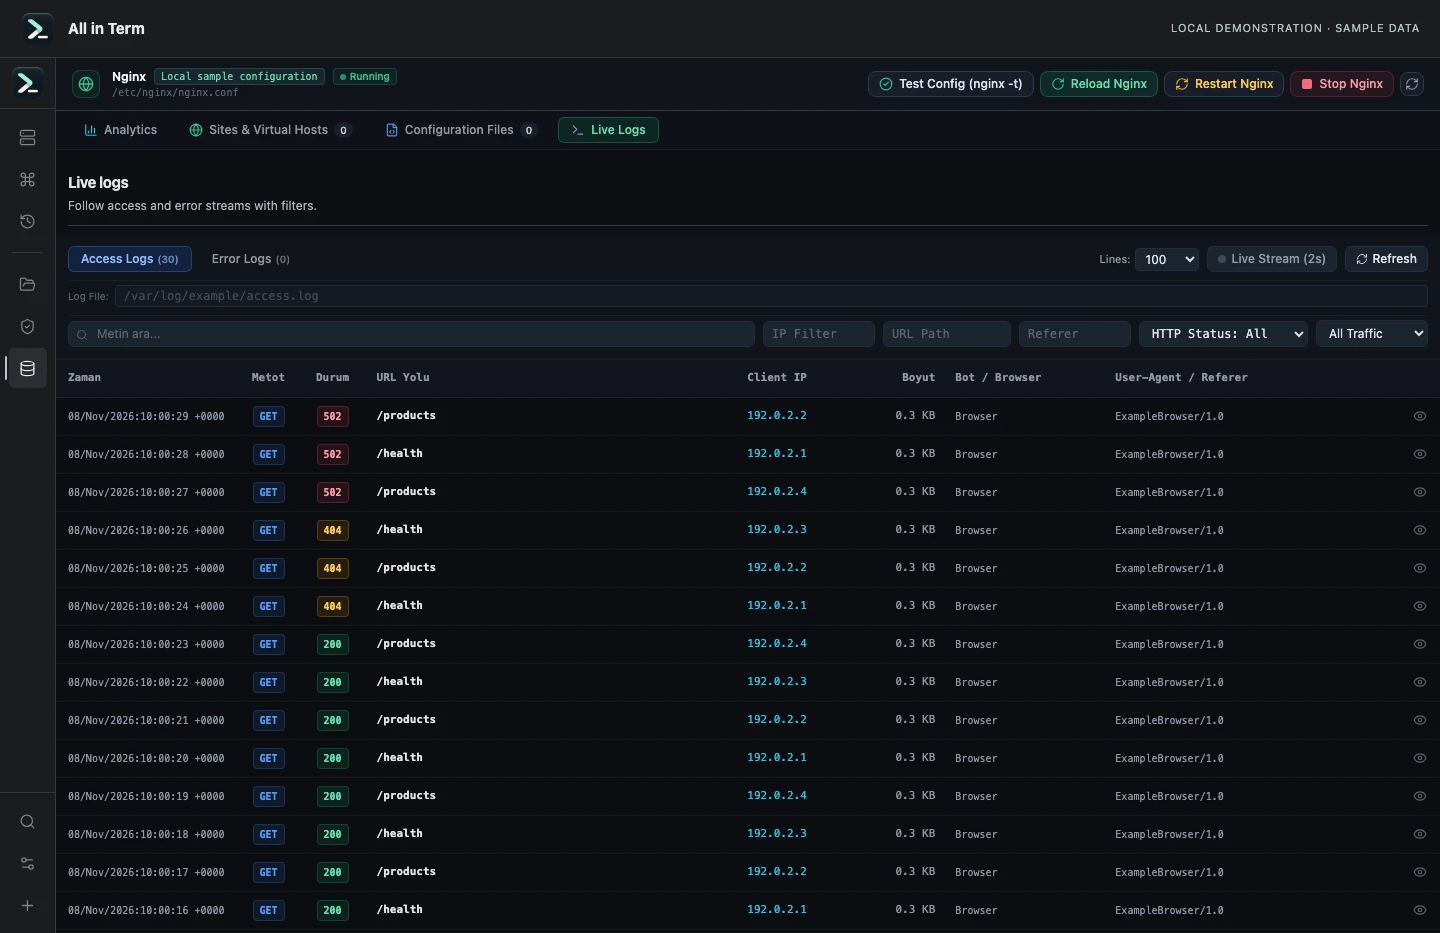
Nginx component displaying results parsed from 30 synthetic request records; no live Nginx server was inspected. Captured 2026-11-08. Open the image to inspect details.
Request totals and HTTP outcomes
Compare available daily aggregates with bounded detail samples. Response classes help explain which part of the access-record population succeeded or failed; the error-log count is a separate observation and is not a request-rate denominator.
Routes, bots and upstream clues
Inspect route groups and meaningful repeated error patterns. User-agent bot categories are useful classifications, but they do not prove client ownership. Correlate the relevant route, timestamp and upstream endpoint before choosing a server change.
Visitor context when collected
Visitor views can show recorded paths, sources and available device context. Rich interaction timelines require explicit collection setup and supporting records; they are not automatically present in ordinary access logs.
Configuration alongside the observation
Inspect virtual hosts and relevant configuration files when the evidence suggests a routing or upstream problem. Validate an intended Nginx configuration change before activation, then repeat the original request to check the application result.
A practical first workflow
- Select the intended host, domain and observation period.
- Review request outcomes and the relevant route or upstream pattern.
- Inspect representative original records and the related configuration.
- After an authorized correction, validate and compare fresh behavior.
Know the current boundaries
- Readable logs, compatible formats and retained files determine the available coverage.
- Browser interaction data requires explicit setup; review collected fields, access and retention before enabling it.
- A syntax test does not by itself establish application health or verify a bot identity.
Frequently asked questions
Does a 500-row detail view mean the entire day has 500 requests?
Not necessarily. Bounded detail samples and daily totals are different views. Read the coverage and count labels before interpreting a number.
Are all error-log entries failed HTTP requests?
They are error events, not a complete request population. Use access-record status counts from the same period to calculate a request failure share.
Does a Googlebot user-agent prove the request came from Google?
No. The string is a claim or classification unless verified through the relevant provider's current process.
Are visitor timelines available without tracking setup?
Richer interaction views require the relevant collection to be enabled and actually present. Missing historical events cannot be reconstructed from a graph.