ALL IN TERM / MACOS WORKSPACE 01 / 06

A terminal app for Mac.
Your servers, together.

Open a local Mac terminal, connect over SSH and manage files with SFTP. Inspect processes, PostgreSQL data, Docker and Nginx without losing the active server context.

Direct SSH Adjustable interface scale 34 connected capabilities
ALL IN TERM / PRODUCT WALKTHROUGHSCENE 01 / 11 · SAMPLE DATA
Production API×
+
Local
EN ⌘KPRO
Production API/ [email protected]
SFTP Tasks Tools

Welcome to Ubuntu 24.04 LTS

Last login: today at 10:42 UTC

deploy@production:/srv/app$ docker ps

CONTAINER ID   NAME      STATUS

a1b2c3d4       api       Up 12 days

e5f6a7b8       redis     Up 12 days

deploy@production:/srv/app$

CONNECTED SSH/srv/app · UTF-8
ANIMATED INTERFACE PREVIEWIllustrative data · no server connection
01 / TERMINAL02 / FILES03 / OBSERVABILITY04 / SYSTEM CARE05 / INFRASTRUCTURE
01 / PRODUCT

Work inside the interface.

Use the graphite workspace below. Open files, switch tools, filter findings and try the terminal. The sample mirrors the app's navigation while keeping all data in this browser preview.

INTERACTIVE PRODUCT PREVIEWSample host · no server connection

Loading interactive preview…

Preview data is illustrative. Commands and controls in this demo do not touch your Mac or a server.

/
THE WORKFLOW

A command is only
the beginning.

Production work crosses boundaries: terminal, file system, network, services and data. All in Term keeps those boundaries visible without turning your workspace into a dashboard maze.

Explore the capability map ↗
02 / CAPABILITIES

The full operating surface.

Twenty-nine specific capabilities, grouped by the work they help you do. Each visual corresponds to a real area of the app.

FIND YOUR WORKFLOW

One workspace. A clearer path to each task.

Explore the capabilities, practical steps and current boundaries that matter to your work.

02 / Connect with confidence

The terminal is only the beginning.

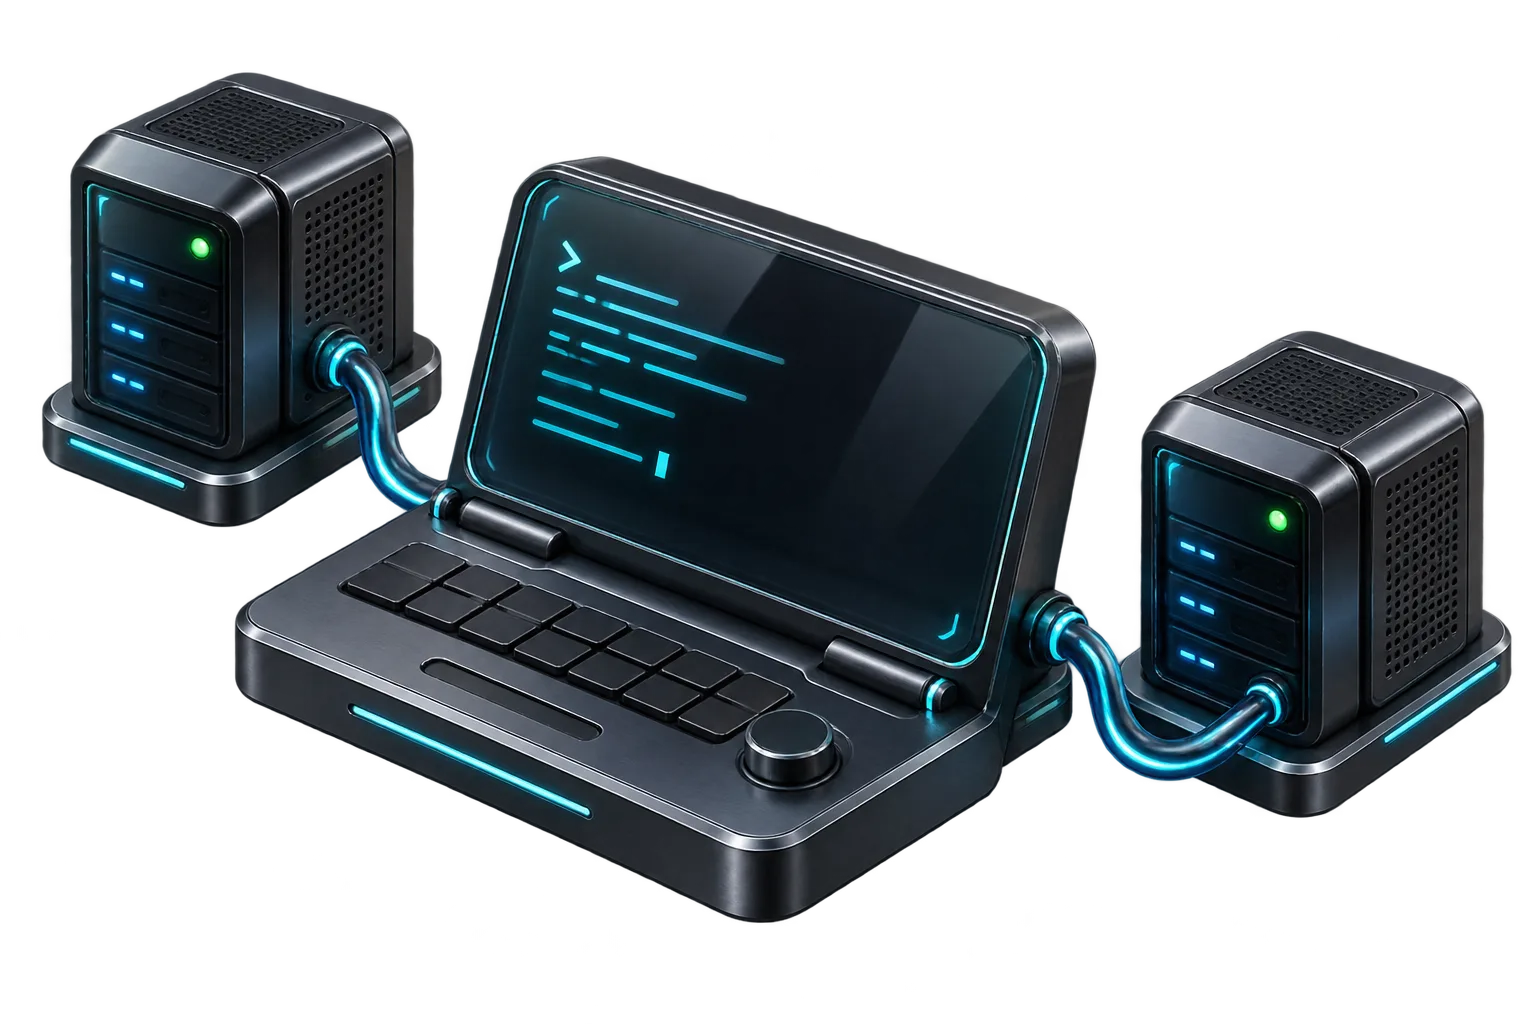
Direct SSH, a local shell and protected connection details start every workflow.

Graphite SSH console linked to remote servers
FEATURE 02 / 35

SSH terminal sessions

Connect to remote hosts in a full terminal with responsive PTY sizing and multiple local or remote session tabs.

  • Password or private-key authentication with passphrase support
  • A connected workspace keeps server context close to your commands
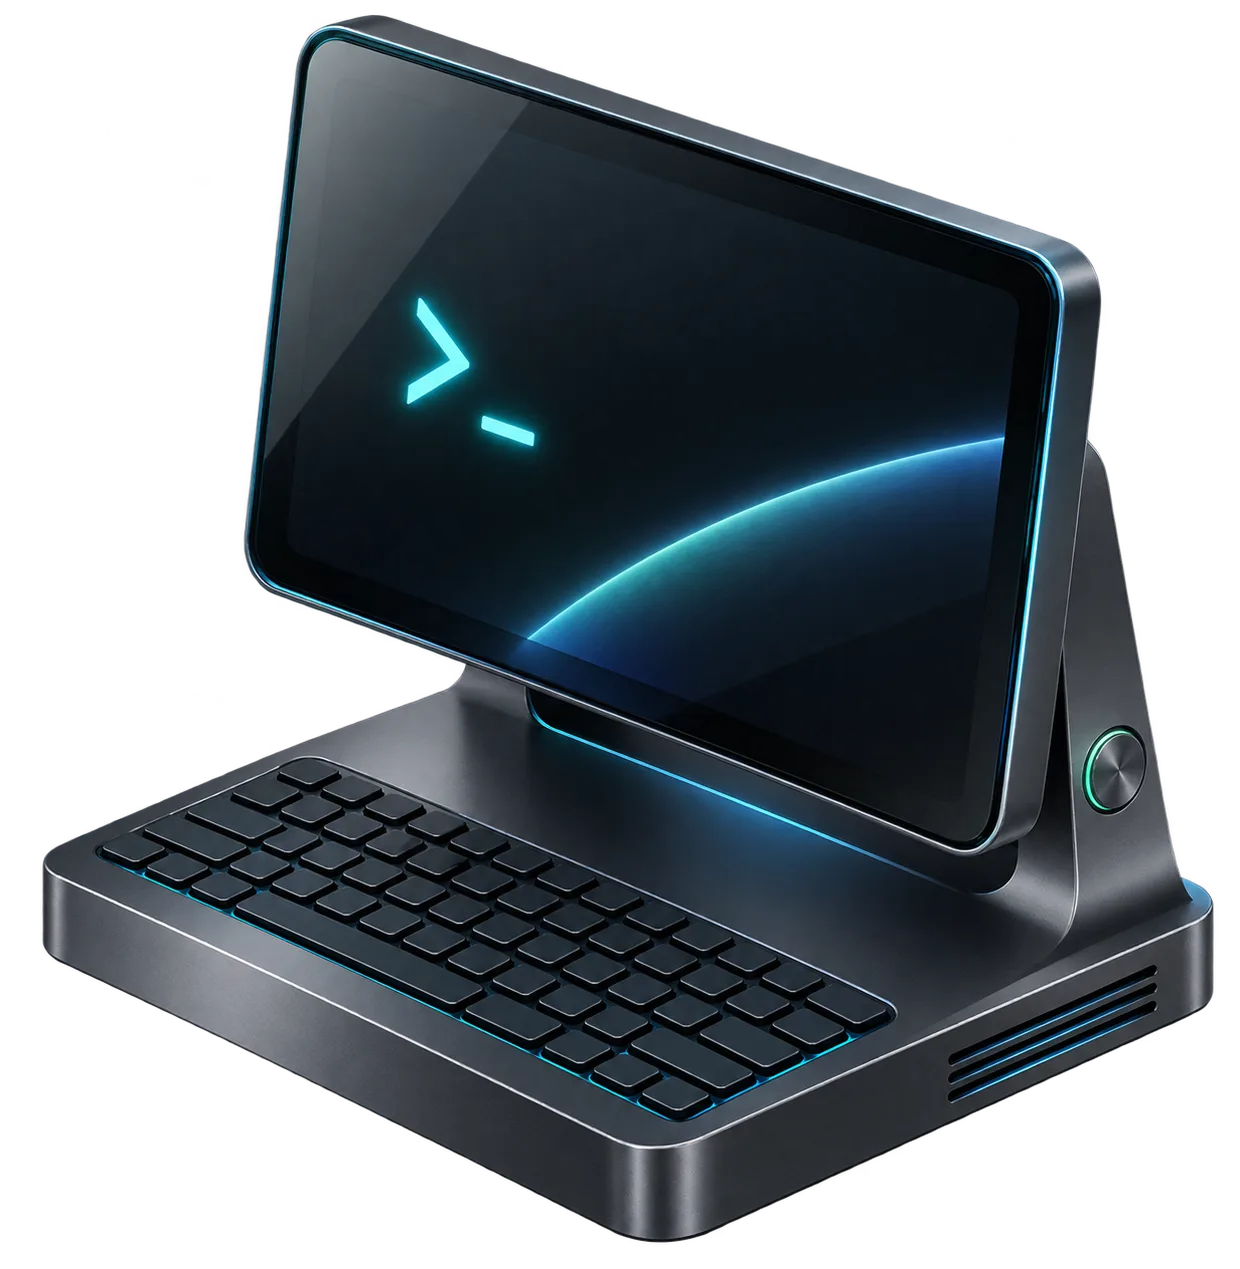
Graphite local terminal console
FEATURE 03 / 35

Local terminal

Open a local macOS shell alongside remote sessions, with the same tabs and keyboard-first flow.

  • Start a local session without creating a server profile
  • Switch between local and SSH tabs without losing context
Secure graphite server vault
FEATURE 04 / 35

Server workspace

Keep saved servers, connection state and quick actions in one organized sidebar.

  • Create and edit host, port, user and authentication details
  • Reconnect and open tools in the context of the active server
Key and lock inside a graphite credential safe
FEATURE 05 / 35

Keychain-backed secrets

Saved credentials use macOS Keychain-backed encryption through Electron safeStorage on your Mac.

  • Private keys and passwords stay protected at rest
  • Direct SSH connections need no persistent monitoring agent
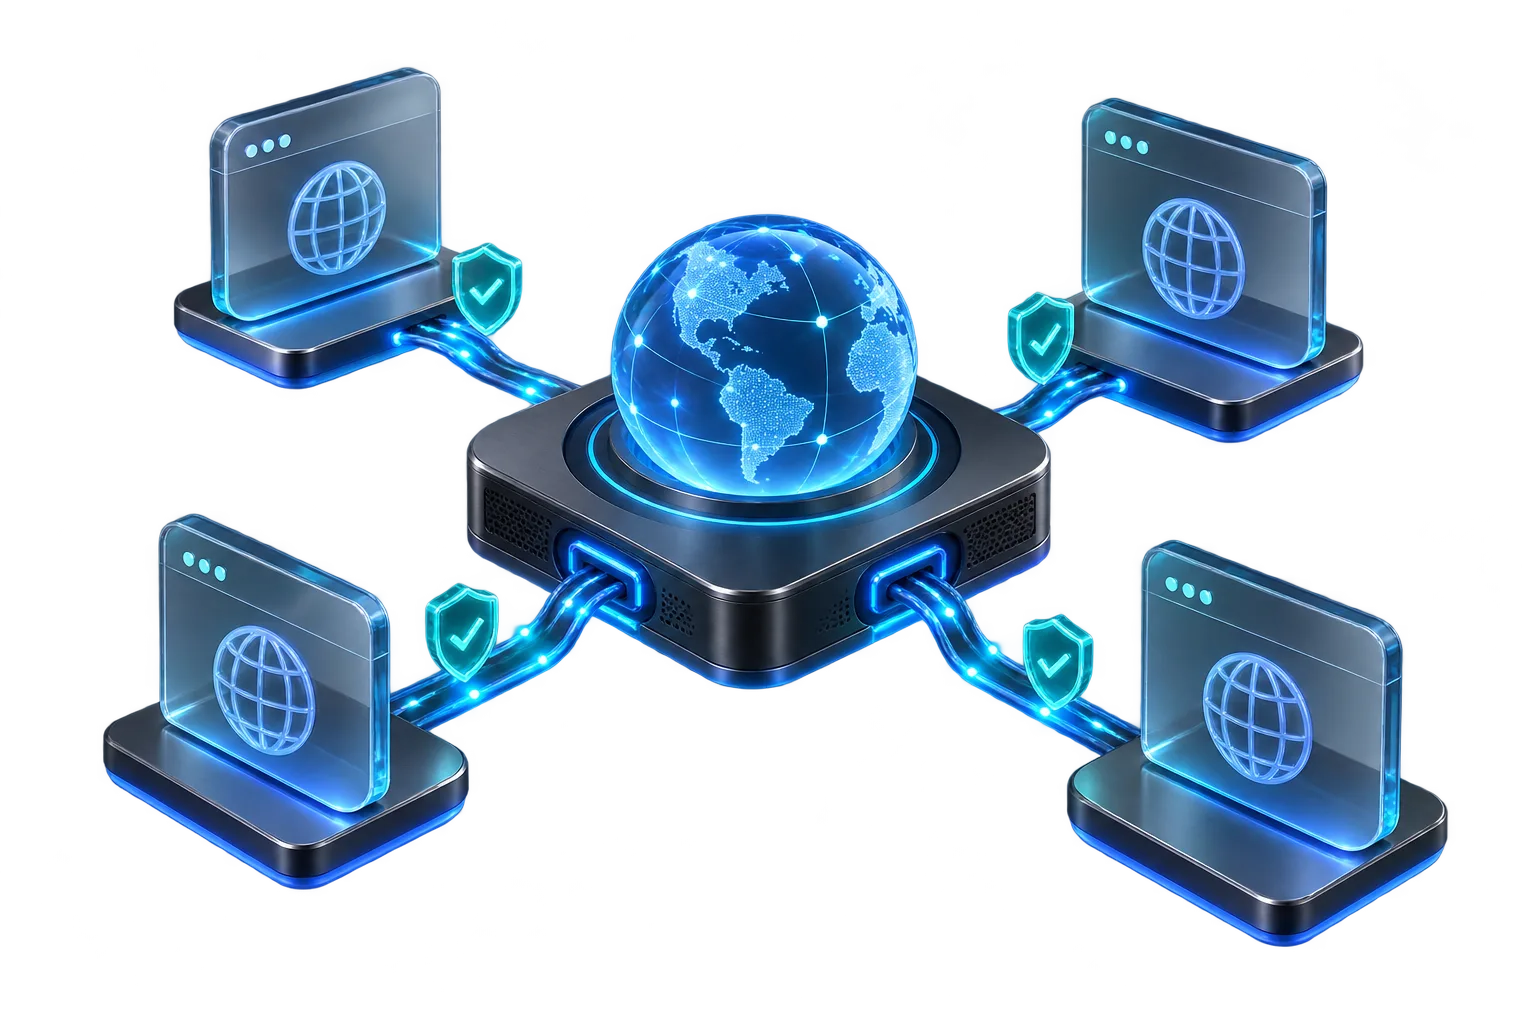
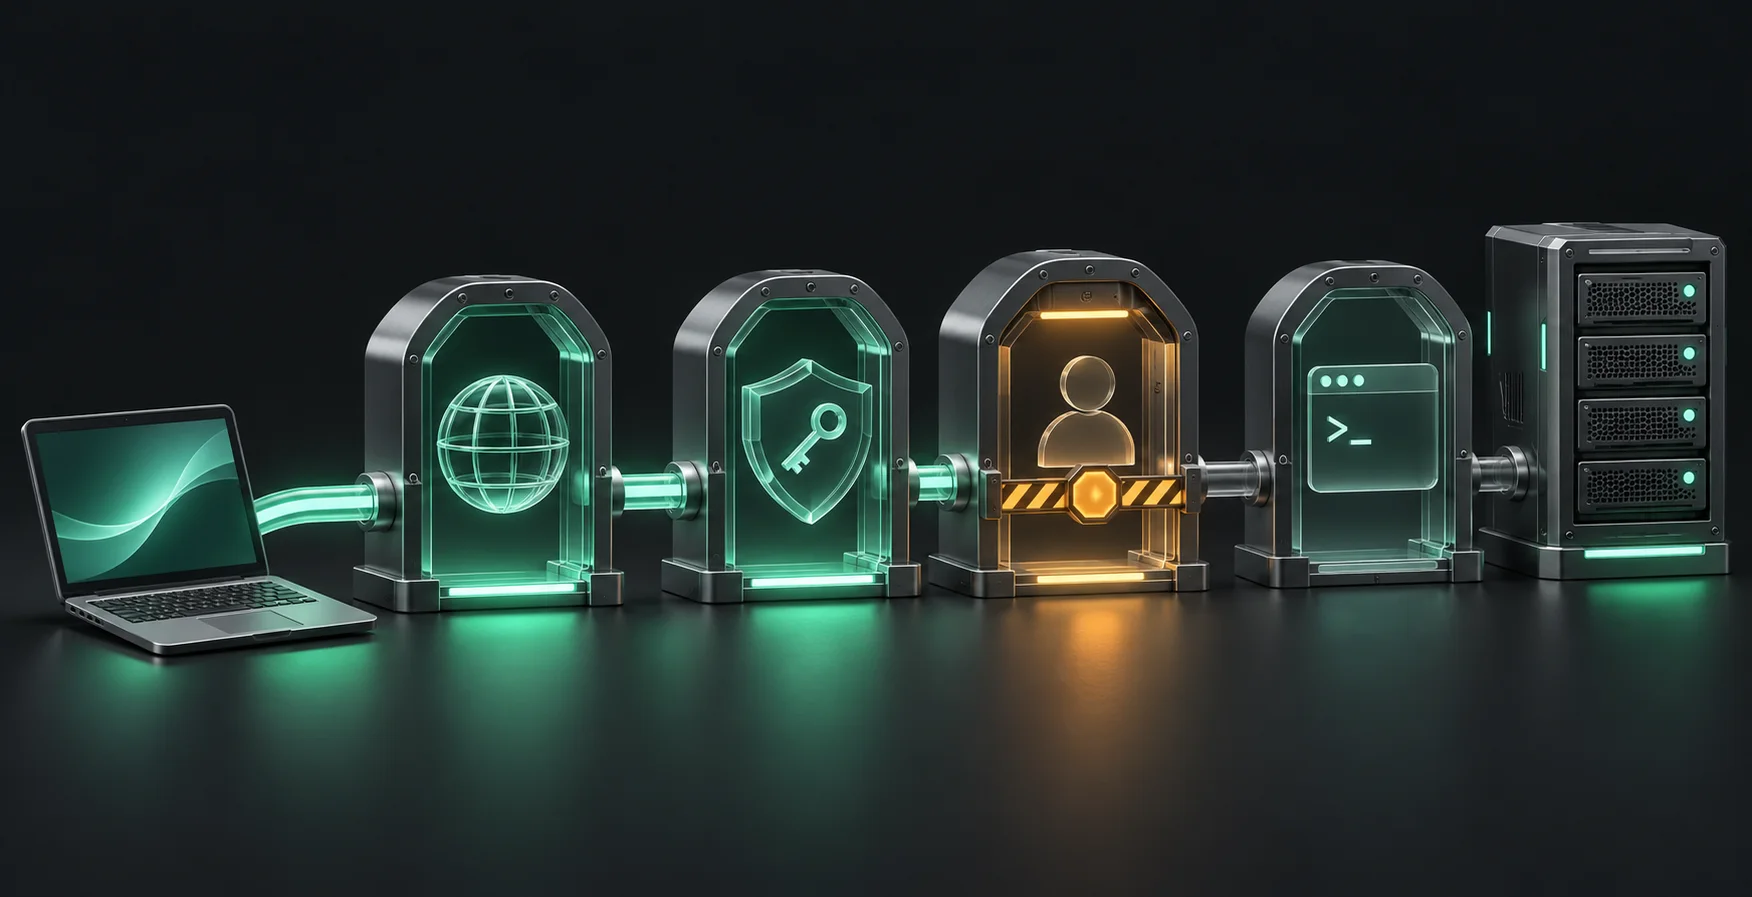
Graphite SSH console with separate server connection paths
FEATURE 31 / 35

Actionable connection diagnostics

Keep the original SSH failure visible and distinguish authentication, key, DNS, timeout, network and terminal-permission problems.

  • Edit the saved connection directly from the failure screen
  • English and Turkish guidance reflects what the server actually reports
03 / Files in context

Remote files feel close at hand.

Go from shell path to file, diff, edit and transfer without rebuilding context.

Layered graphite remote file explorer
FEATURE 06 / 35

SFTP file explorer

Browse remote directories visually, search files, sort columns and stay aligned with your terminal path.

  • Follow the shell directory or browse independently; search into subfolders
  • Save favorite folders for each server and reopen important paths quickly
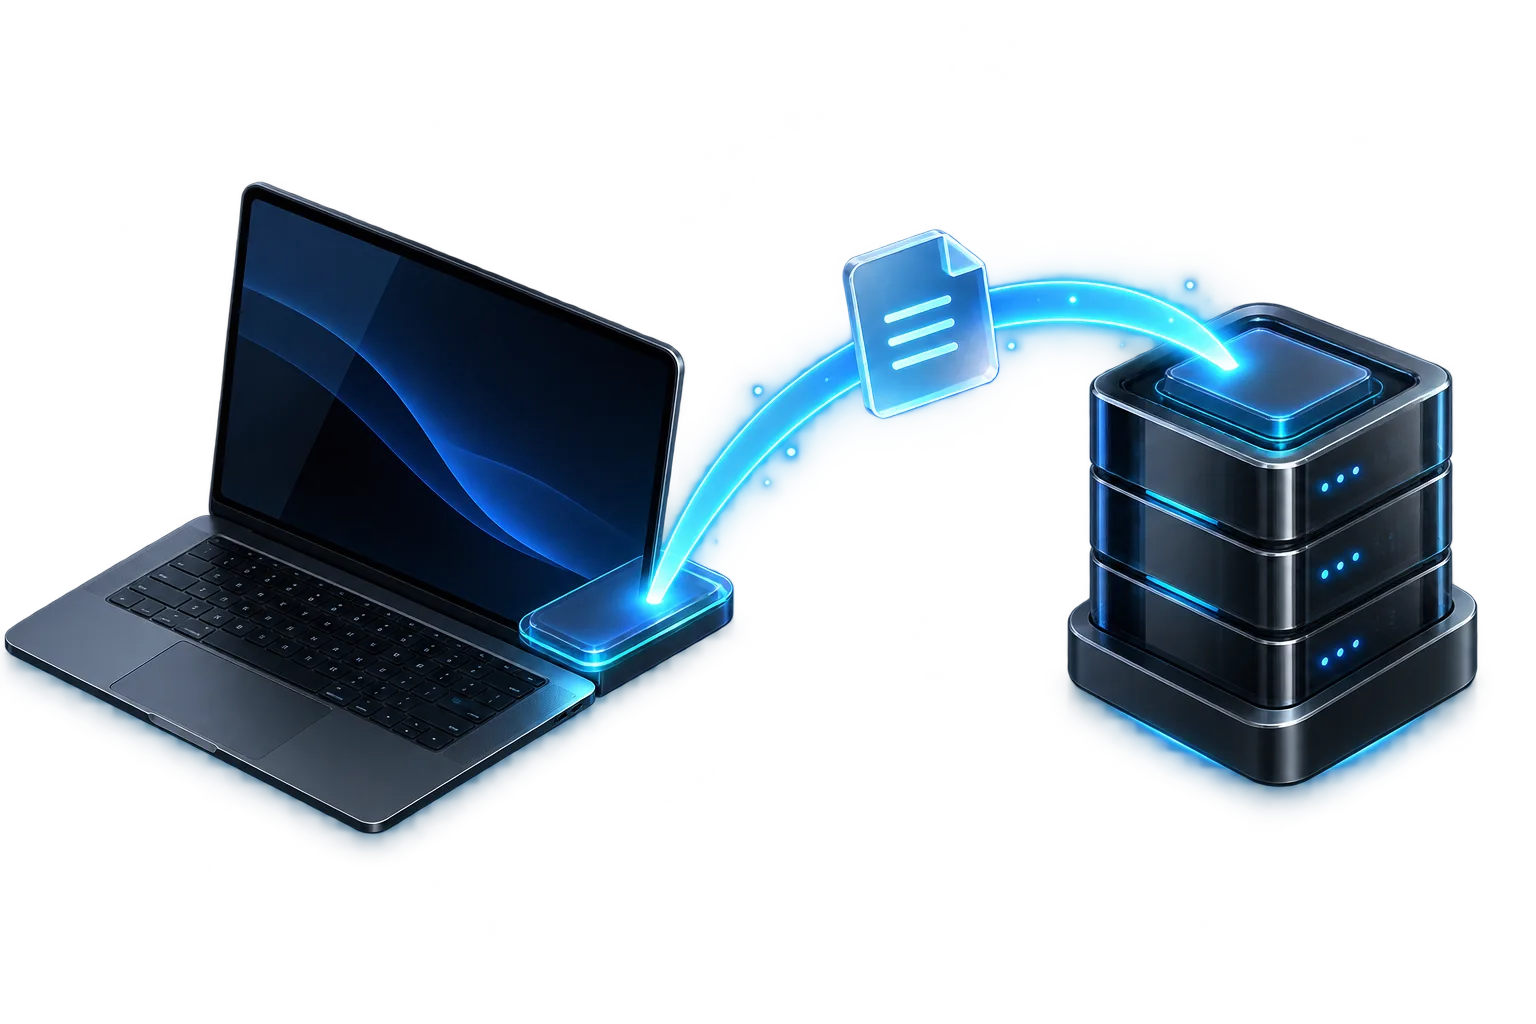
File moving from laptop to remote server
FEATURE 07 / 35

Finder drag and drop

Move files or folders from Finder into the terminal or SFTP workspace and watch transfer progress.

  • Upload to the current remote directory
  • See progress, speed and completion feedback
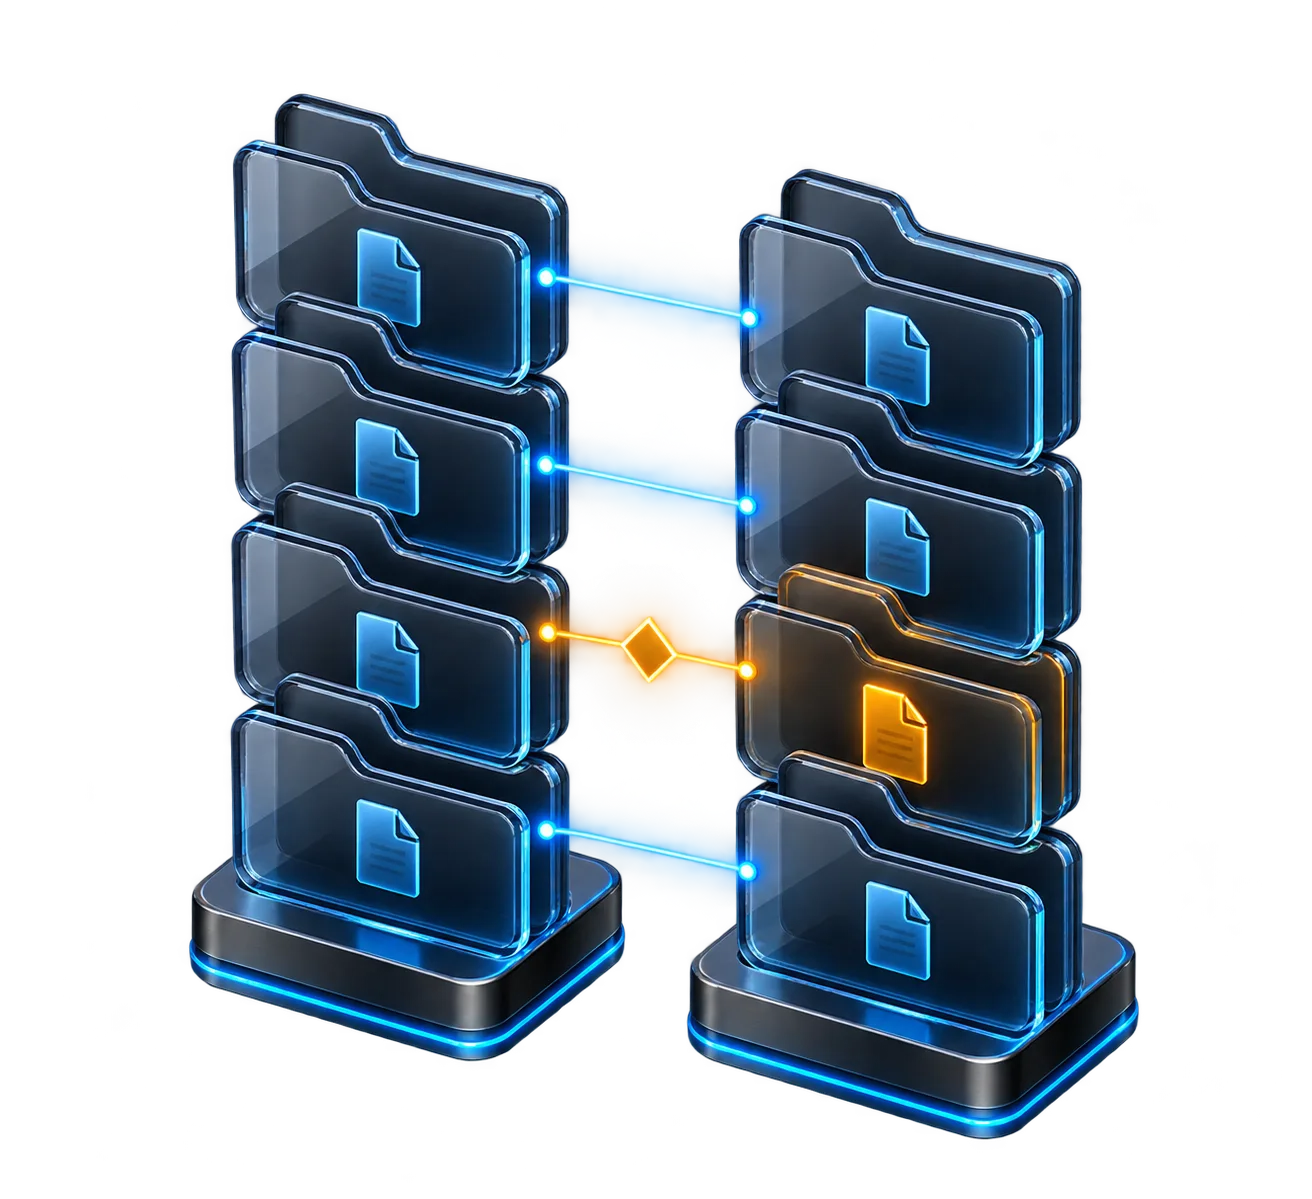
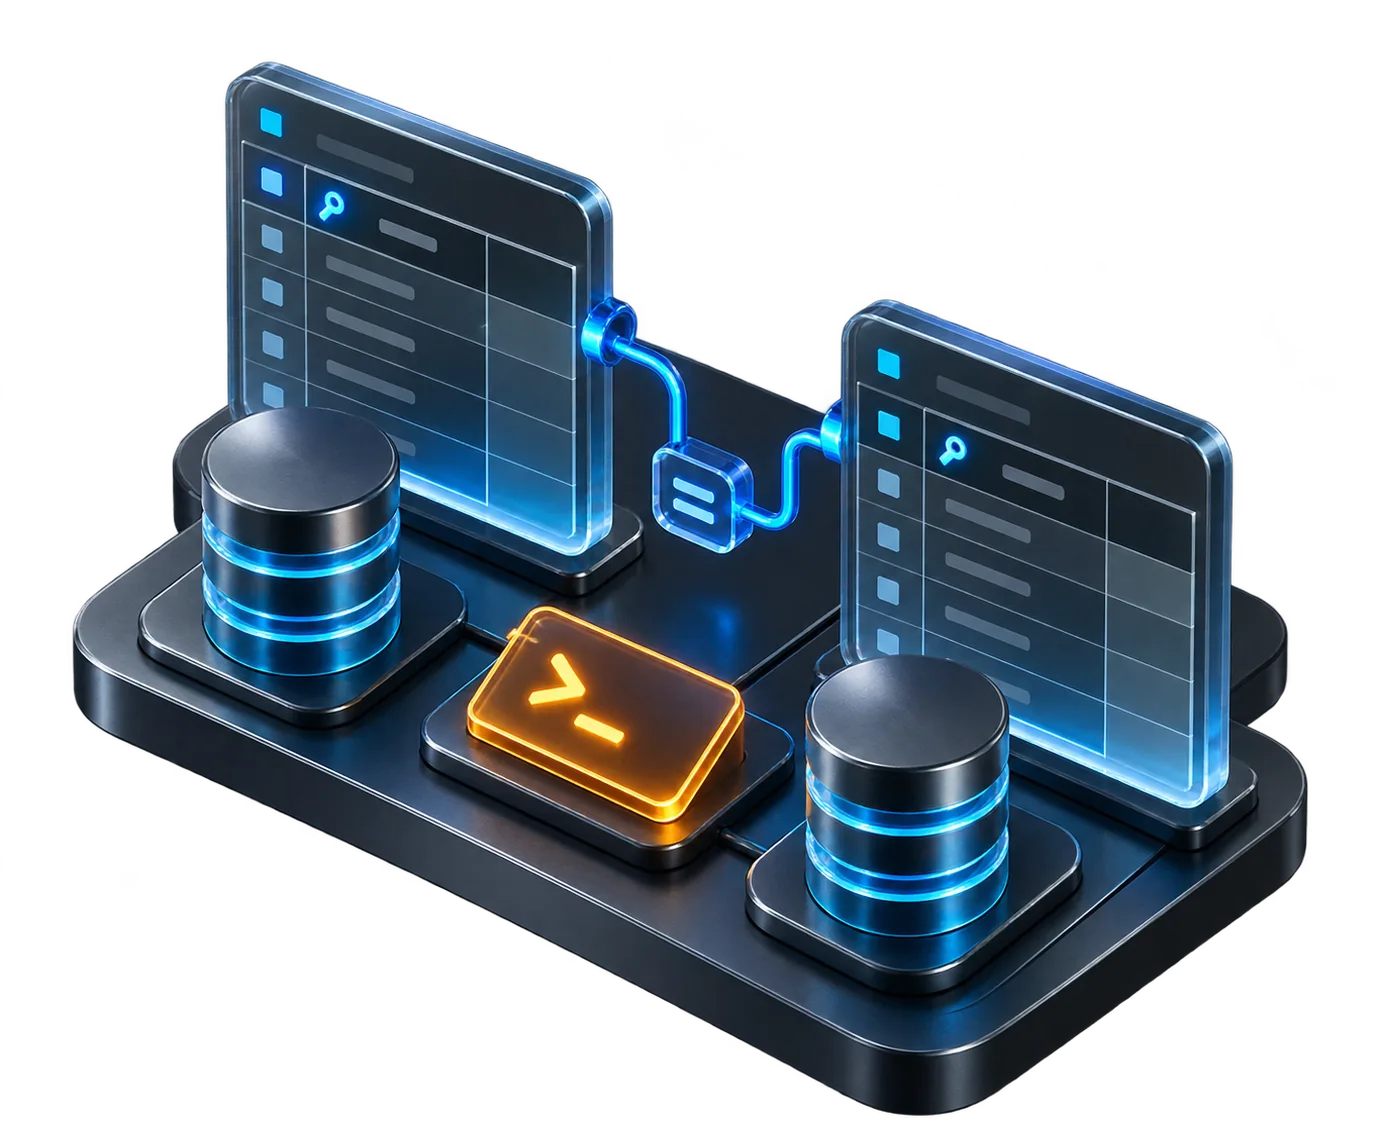
Two folder groups compared with highlighted differences
FEATURE 08 / 35

Visual folder comparison

Compare a local folder with a remote directory before synchronizing individual files or batches.

  • Color-coded additions, removals and changed lines make differences clear
  • Review differences before push or pull actions
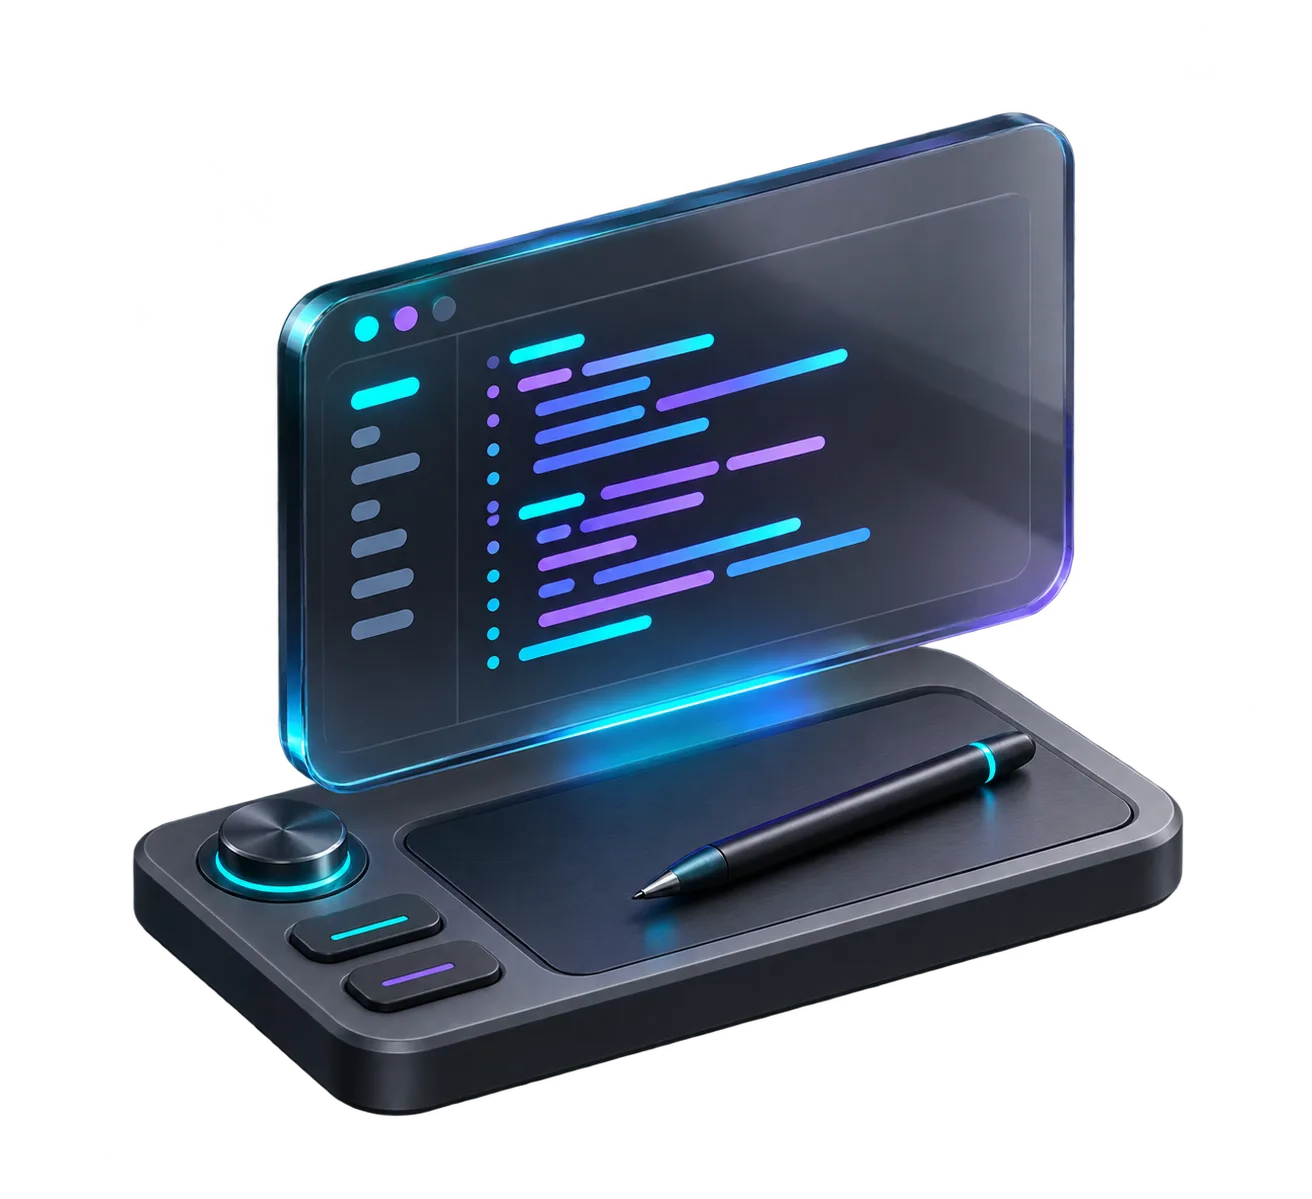
Floating code editor on graphite workbench
FEATURE 09 / 35

Remote code editor

Open text files on the server, edit with syntax-aware presentation and save in the same workspace.

  • Find and replace text, jump to a line and toggle word wrap
  • Track unsaved changes; follow appended log content in a separate read-only mode
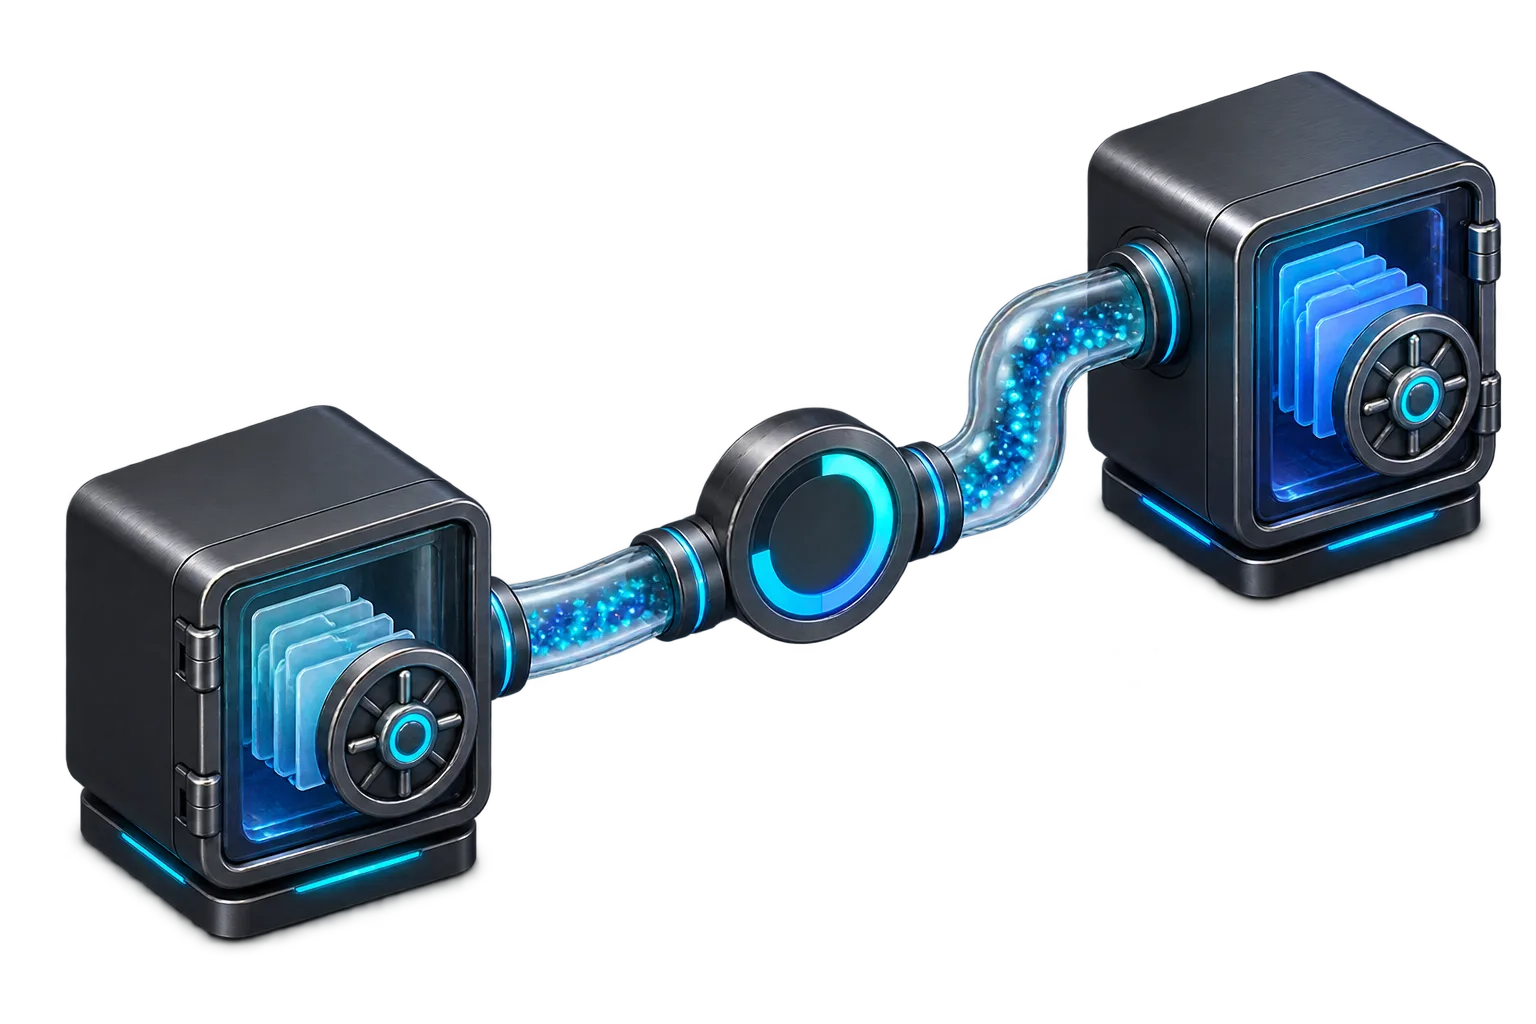
Glowing transfer conduit between secure file vaults
FEATURE 10 / 35

Transfers and archives

Transfer directories, download selected files and handle archives without leaving the server context.

  • Follow transfer progress for long-running operations
  • Create or extract common archive formats through the file manager
Remote file explorer with layered directory locations
FEATURE 32 / 35

Server-specific favorite folders

Keep useful remote directories within reach without mixing paths from different servers.

  • Star directories or drag folders into the favorites area
  • Choose terminal-follow mode or navigate independently
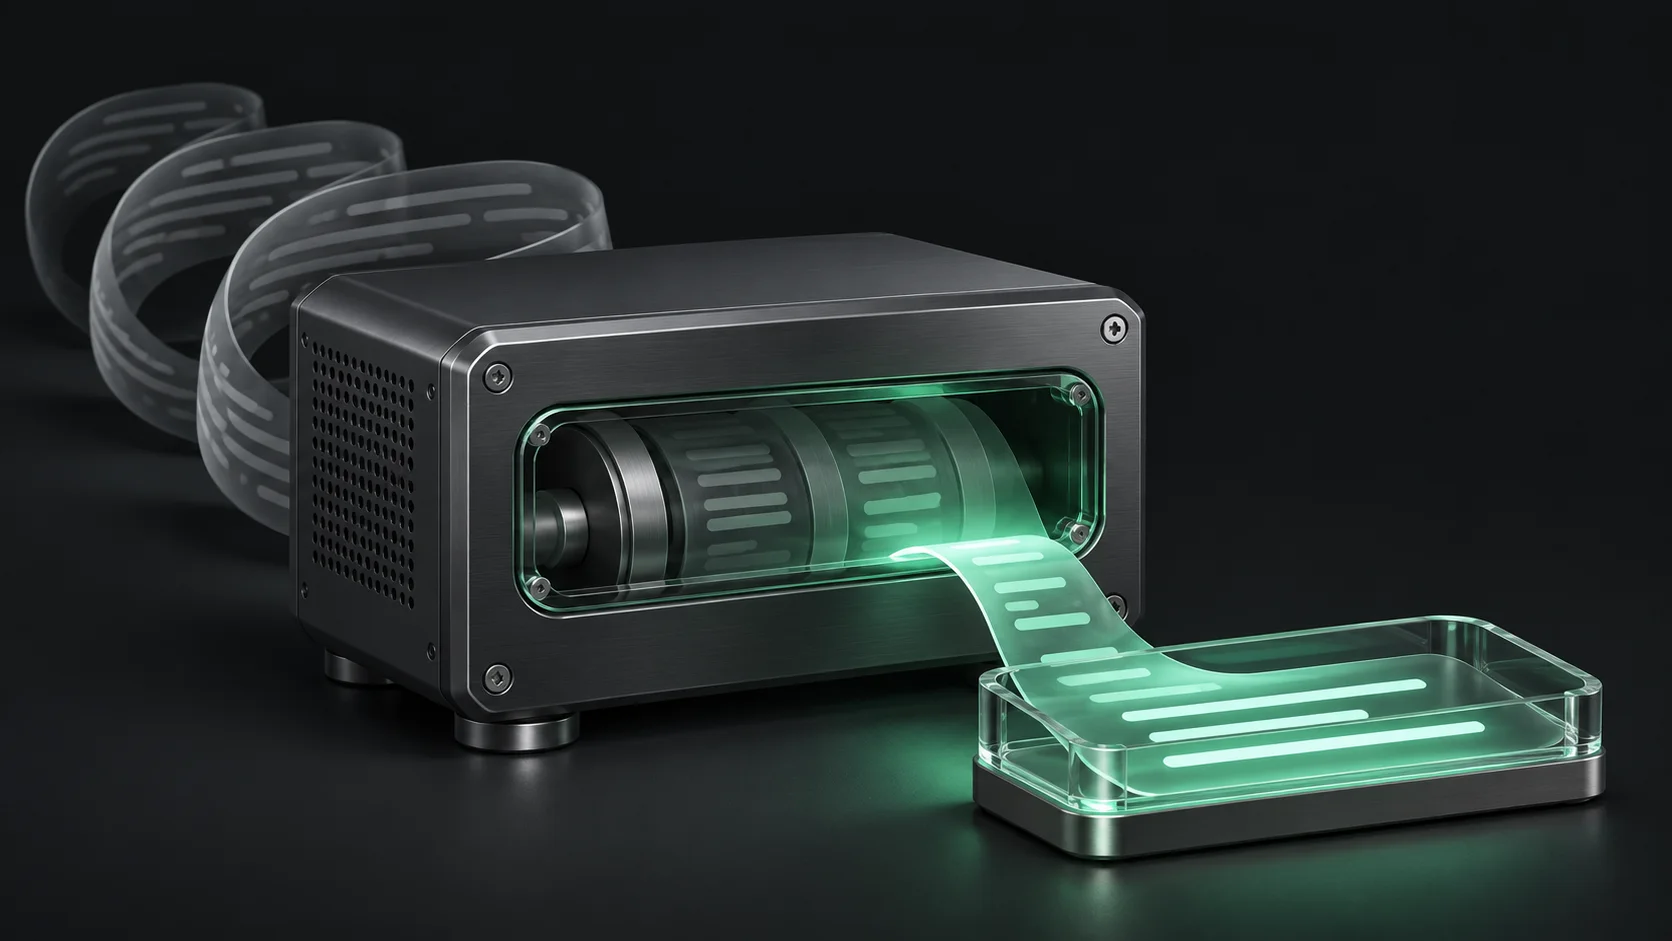
Floating editor showing a bounded stream of remote text
FEATURE 33 / 35

Live remote log following

Follow appended log content from the remote editor while retaining a bounded text window.

  • Read newly appended bytes rather than repeatedly loading the whole file
  • Stop following before editing; live-follow mode is read-only
04 / Observe the whole host

Make server state visible.

Processes, performance, listeners, disks and schedules turn command output into a readable operating view.

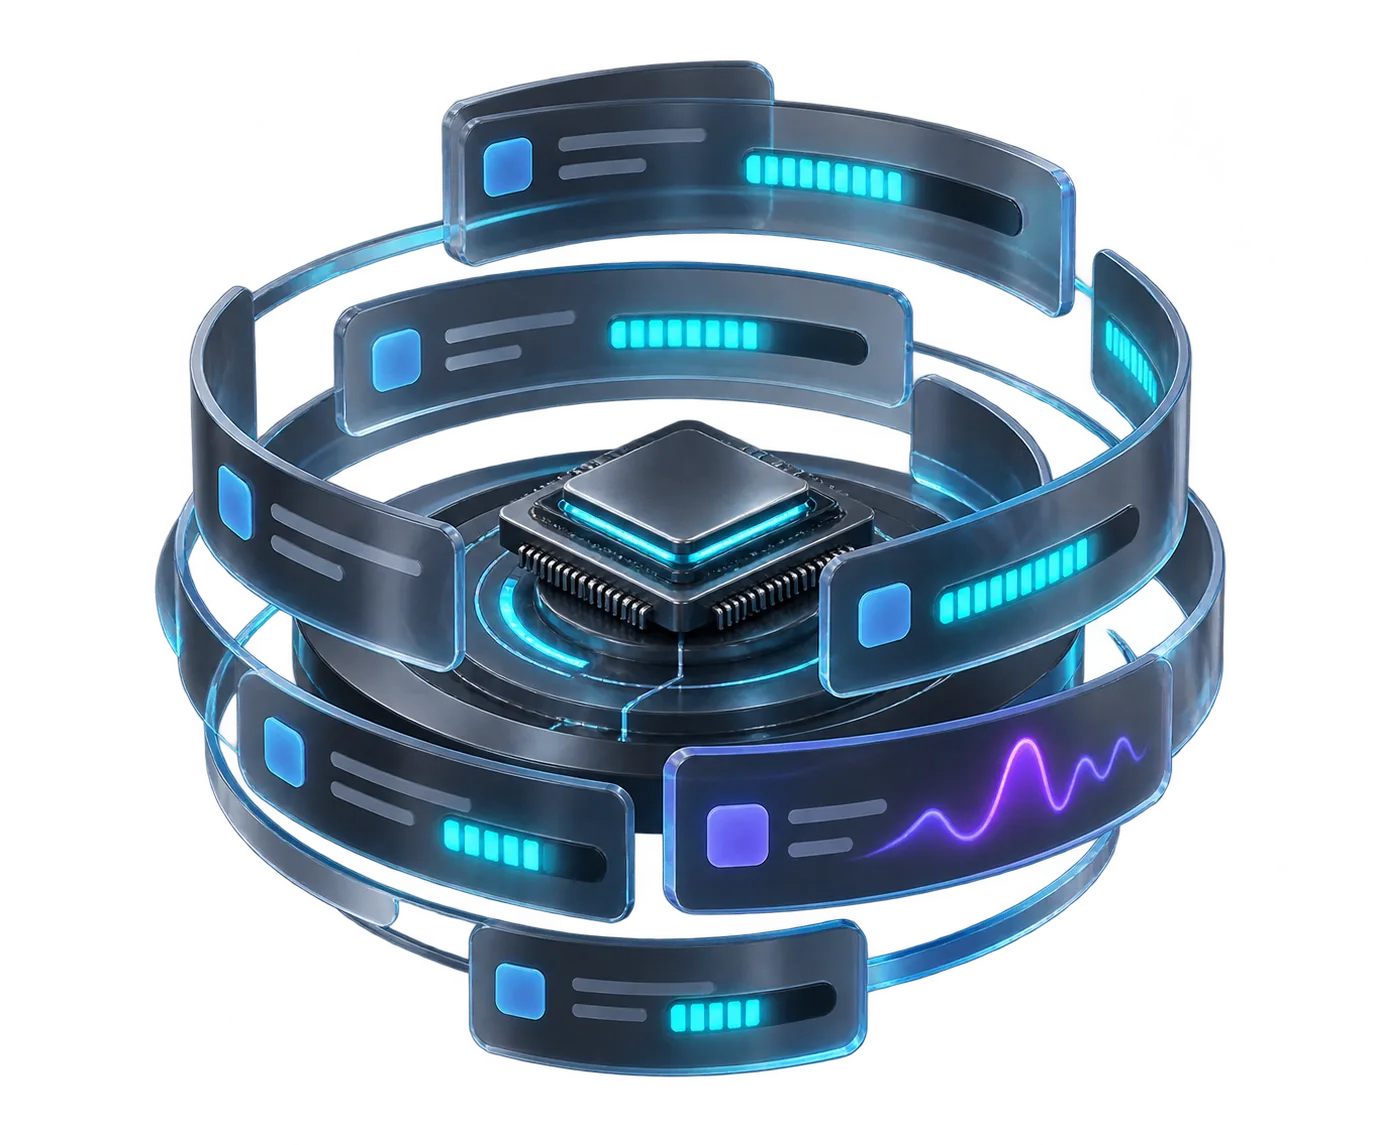
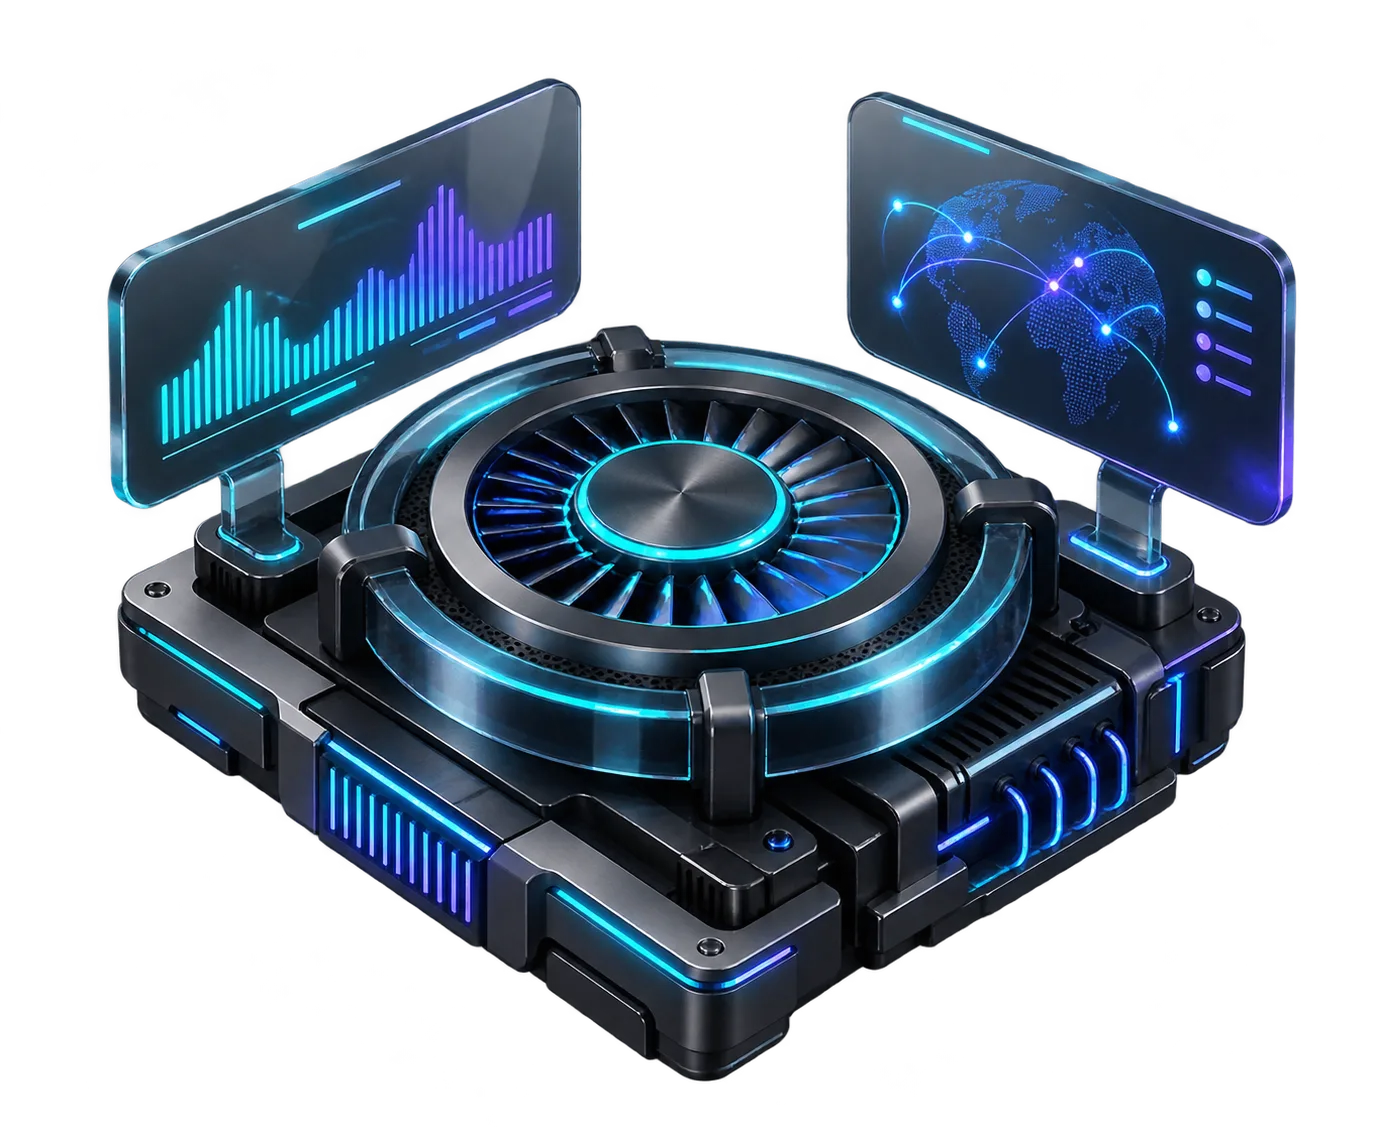
CPU core surrounded by process telemetry rows
FEATURE 11 / 35

Process explorer

Inspect live processes with CPU, memory, PID, user and command details in a dense, sortable view.

  • Search by name, command or PID
  • Review the process before any termination action
Graphite performance engine and floating telemetry charts
FEATURE 12 / 35

Live performance

Watch CPU, RAM, swap and system information while identifying the biggest resource consumers.

  • Refresh metrics on a chosen interval
  • See top processes alongside whole-system readings
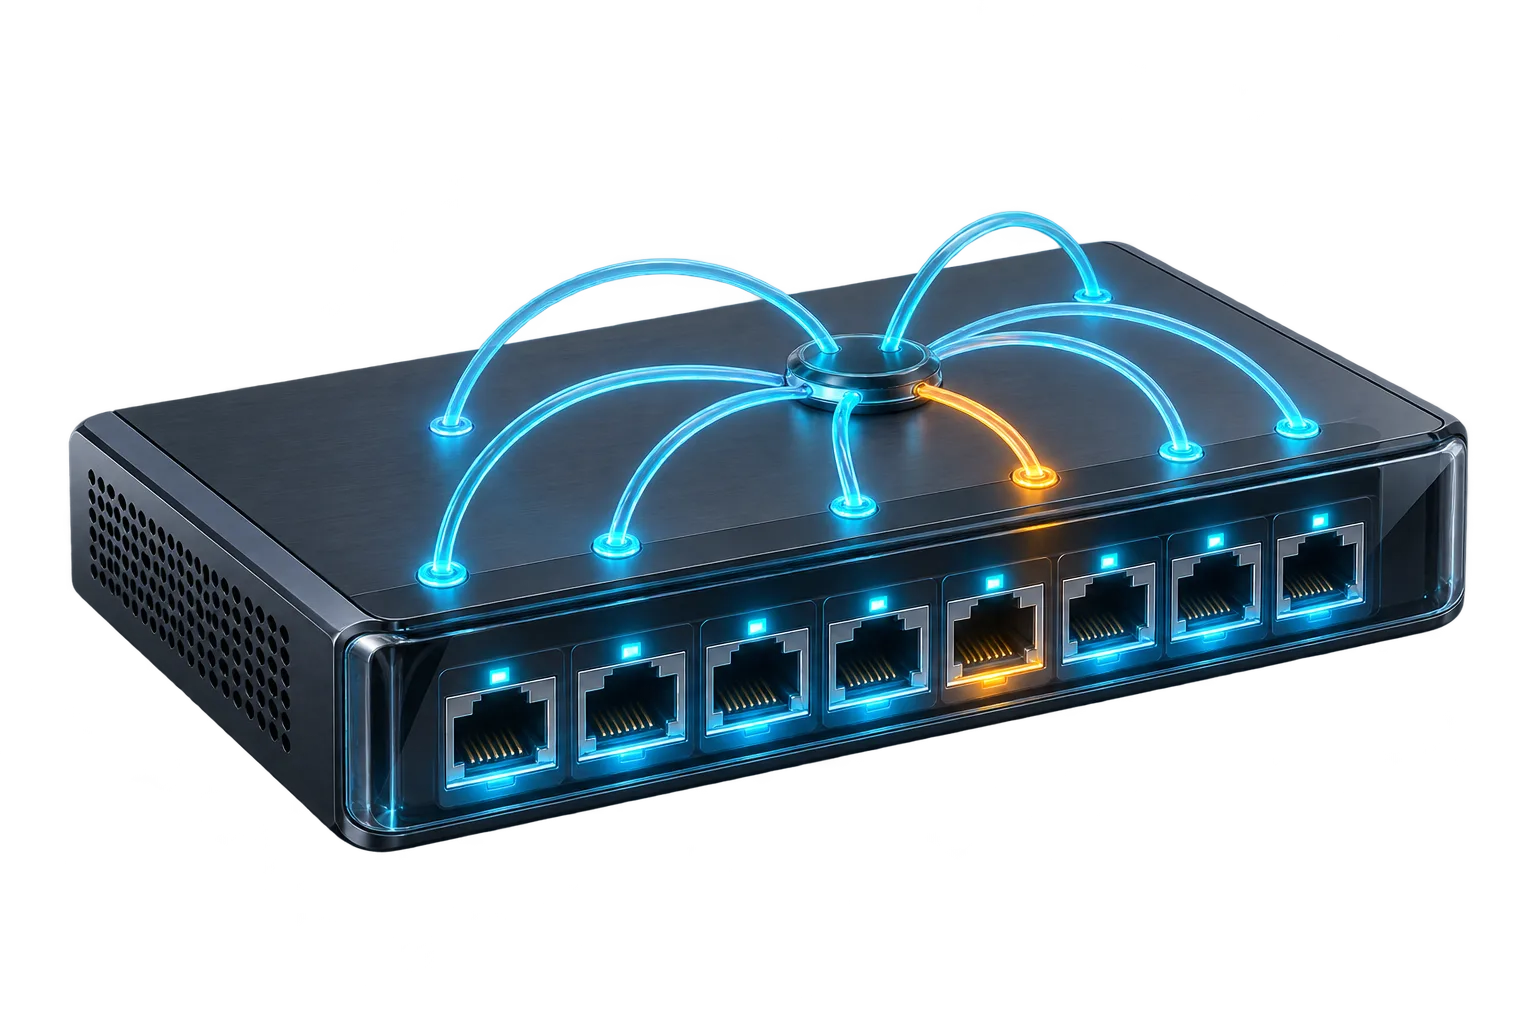
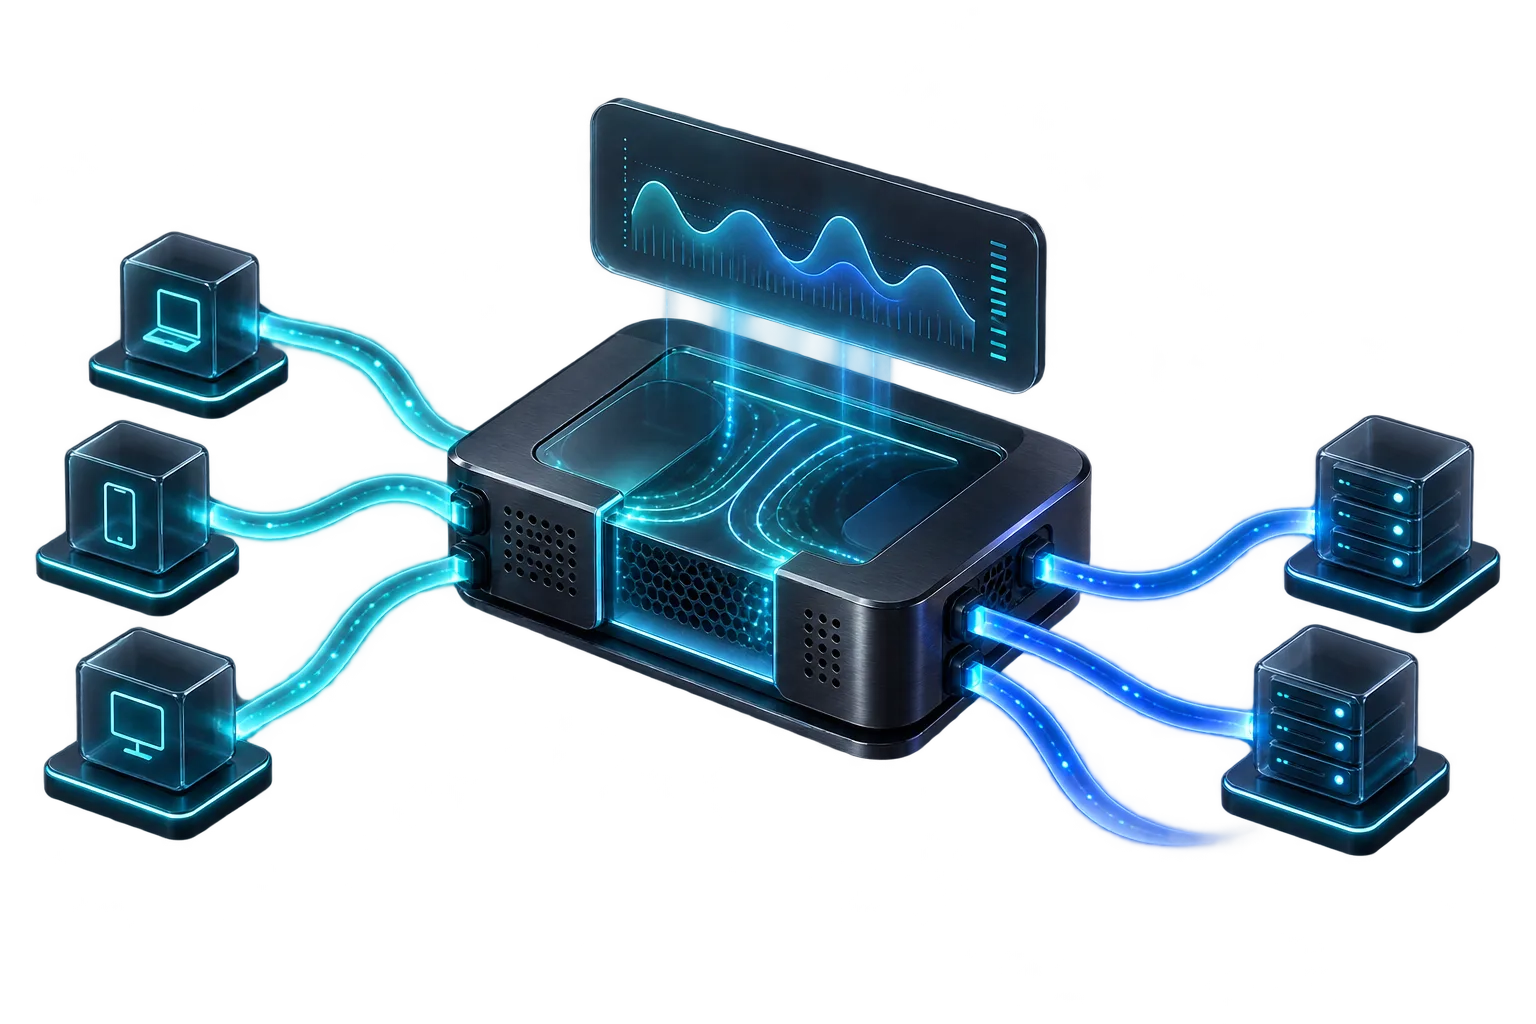
Graphite network switch with illuminated ports
FEATURE 13 / 35

Listening port map

Find TCP and UDP listeners, their bind addresses and the processes that own them.

  • Search ports and process names
  • Resize table columns to inspect long command lines
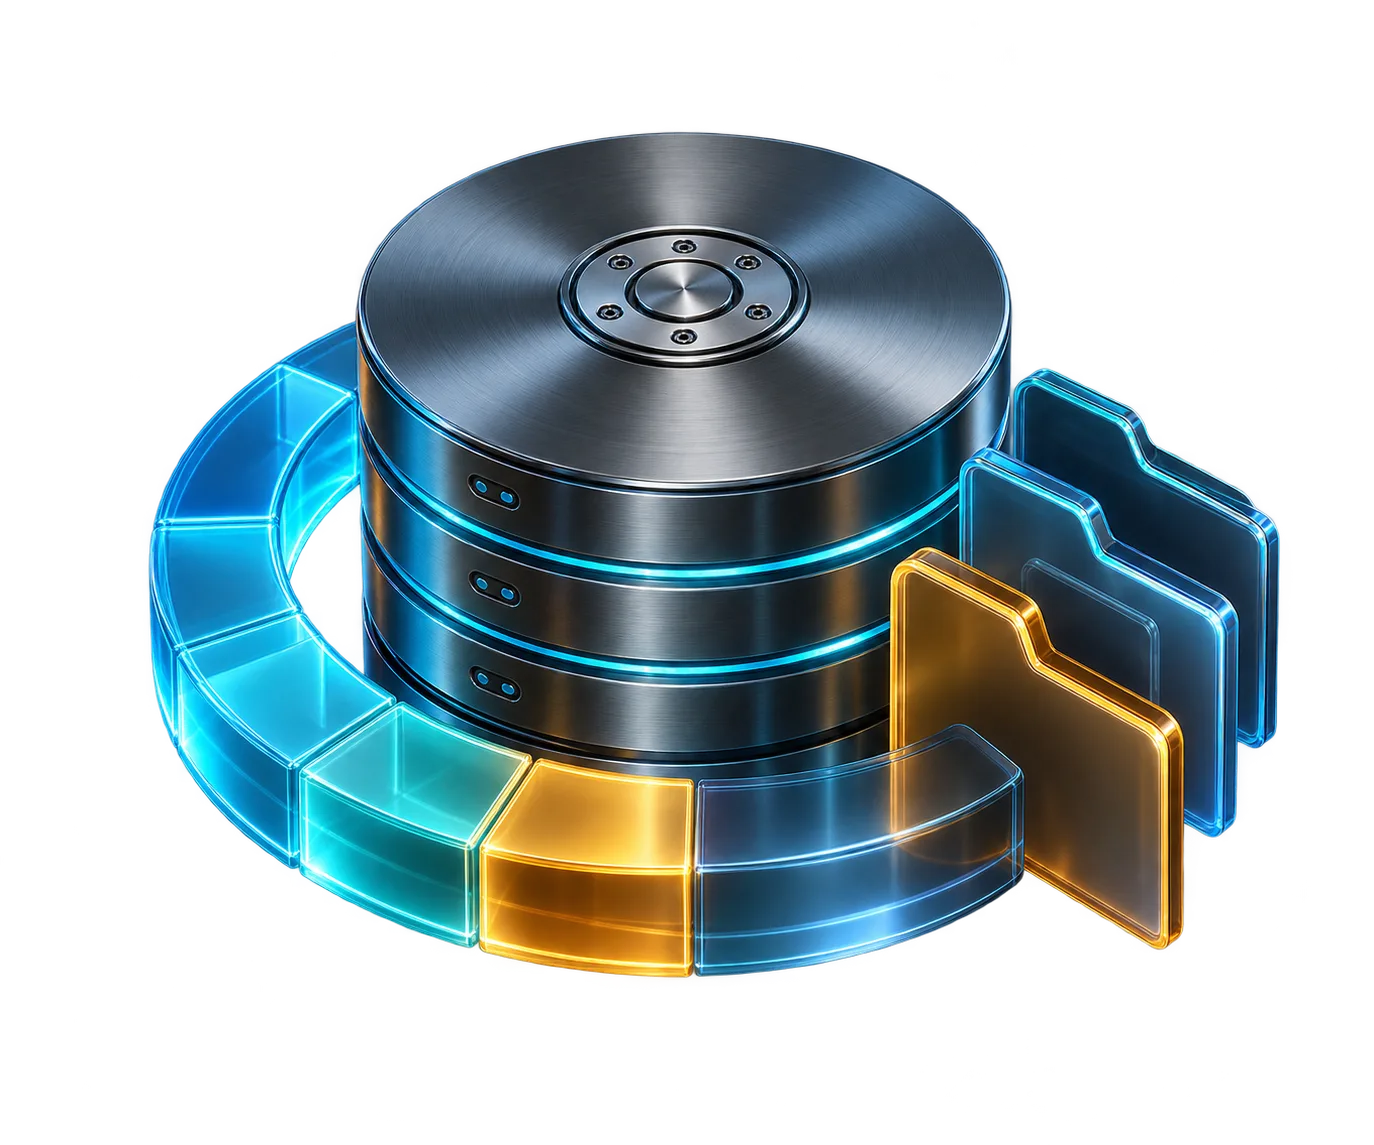
Storage platters surrounded by segmented capacity ring
FEATURE 14 / 35

Disk and directory analysis

Compare mounted partitions and investigate where storage is going through a directory scan.

  • Identify large directories and files
  • Keep capacity and scan findings in one view
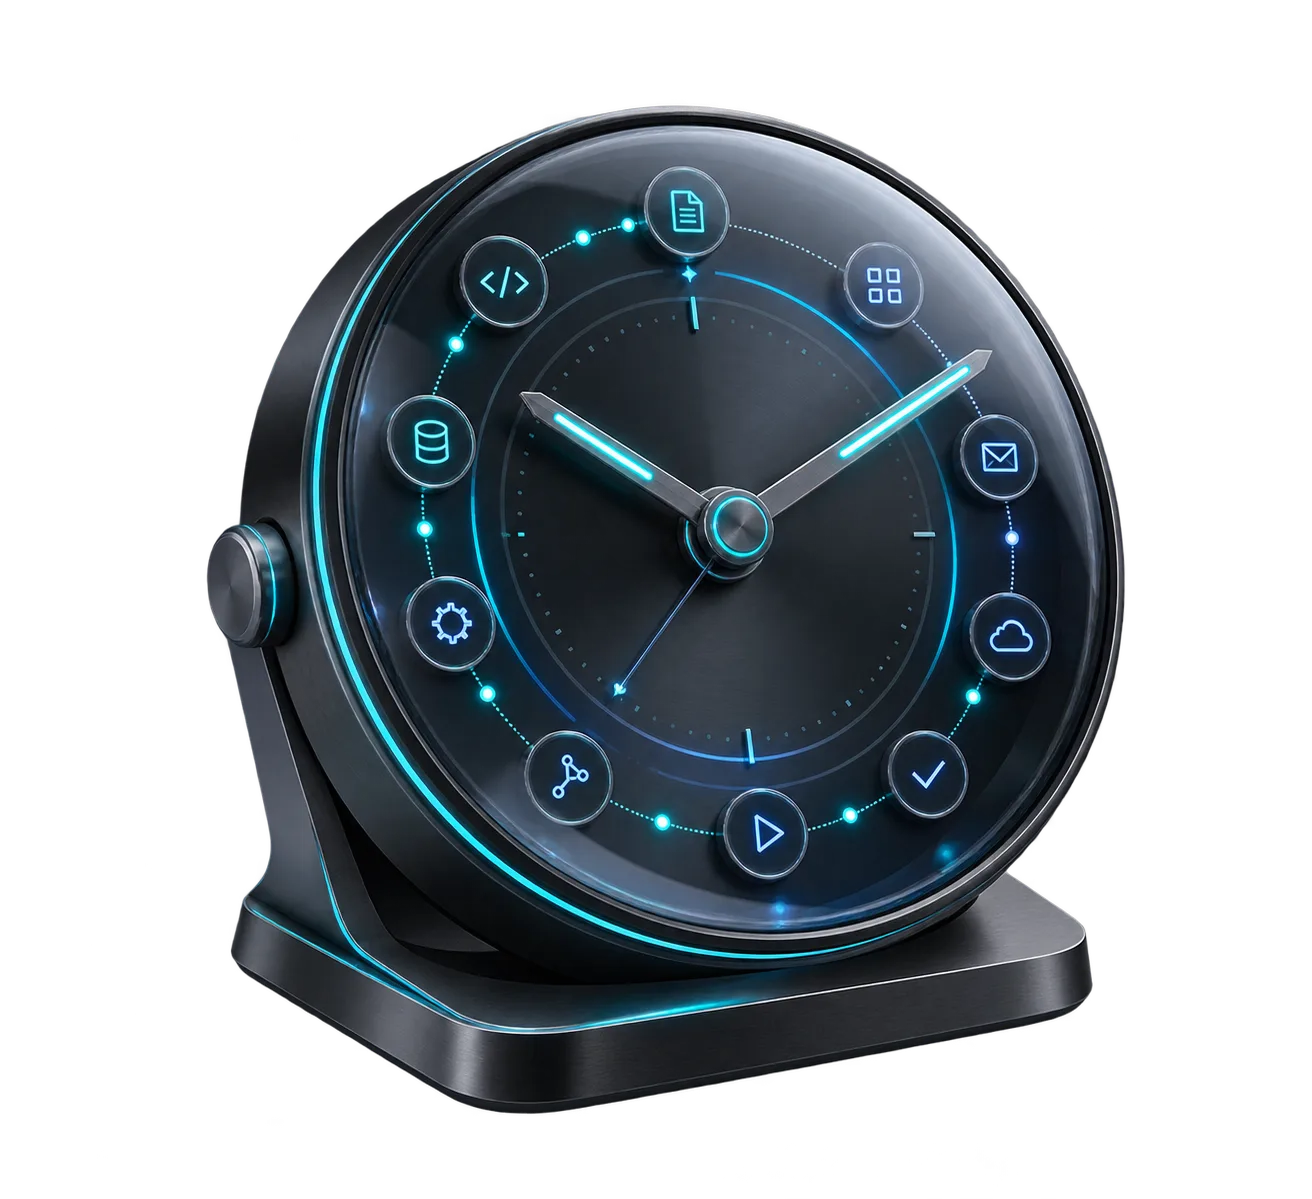
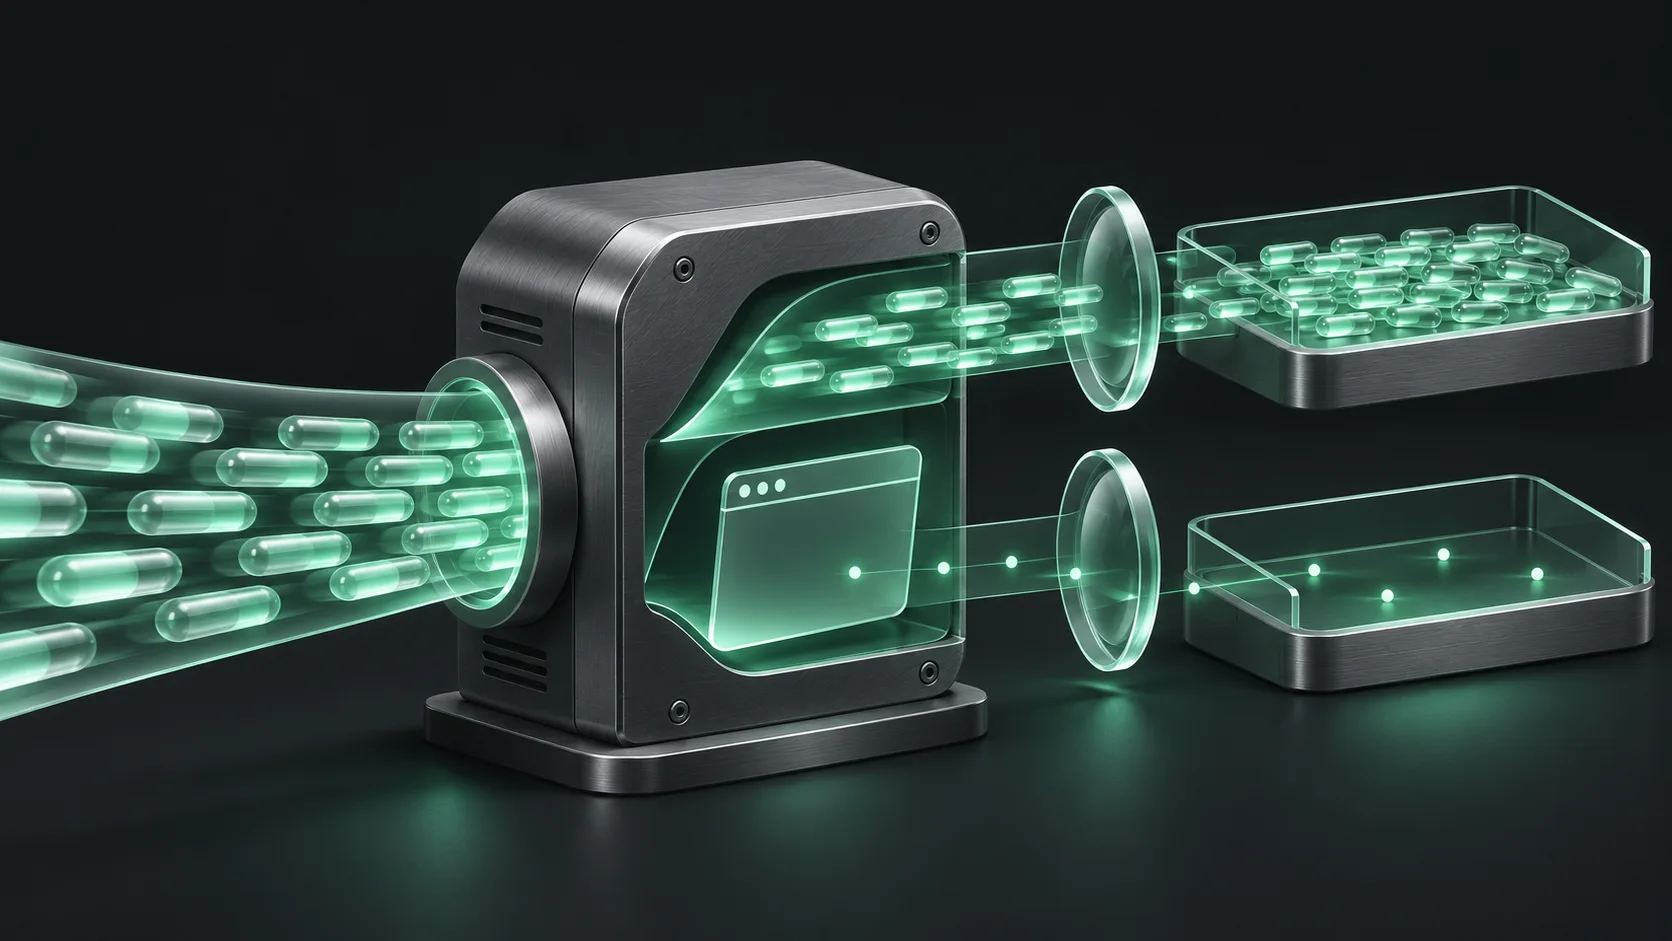
Precision graphite scheduling clock
FEATURE 15 / 35

Scheduled tasks

Read cron schedules as human-friendly jobs, then inspect, create, edit or toggle tasks deliberately.

  • Search commands and timing rules
  • See enabled status before changing a schedule
05 / System Care

Diagnose before you accelerate.

Detailed scans explain what is slow, what consumes space and which security signals need human review.

Graphite server inside a health diagnostic ring
FEATURE 16 / 35

Explainable health scan

System Care combines performance, storage, services and security observations into a prioritized report.

  • See a score with underlying findings and recommended follow-up
  • Export a text report of vitals, findings and available action logs
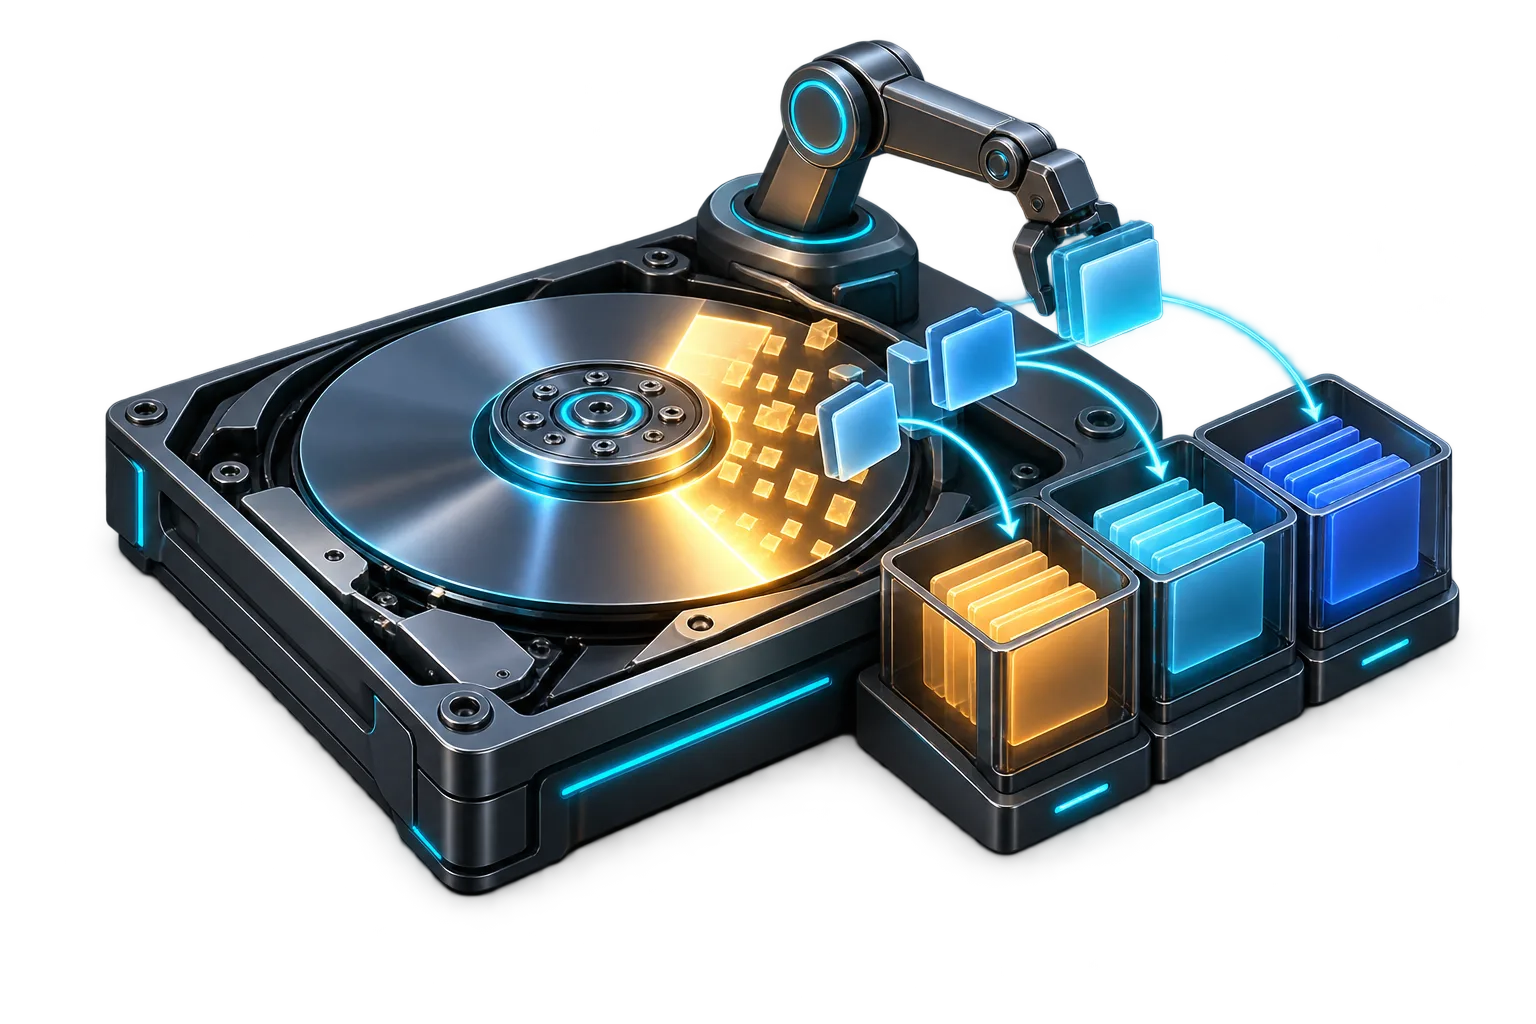
Graphite cleanup sorter and storage platter
FEATURE 17 / 35

Storage cleanup analysis

Find logs, package residue, temporary files and developer caches by size and category.

  • Inspect selected items and estimated recoverable space
  • Use the separate one-click speed and space workflow when appropriate
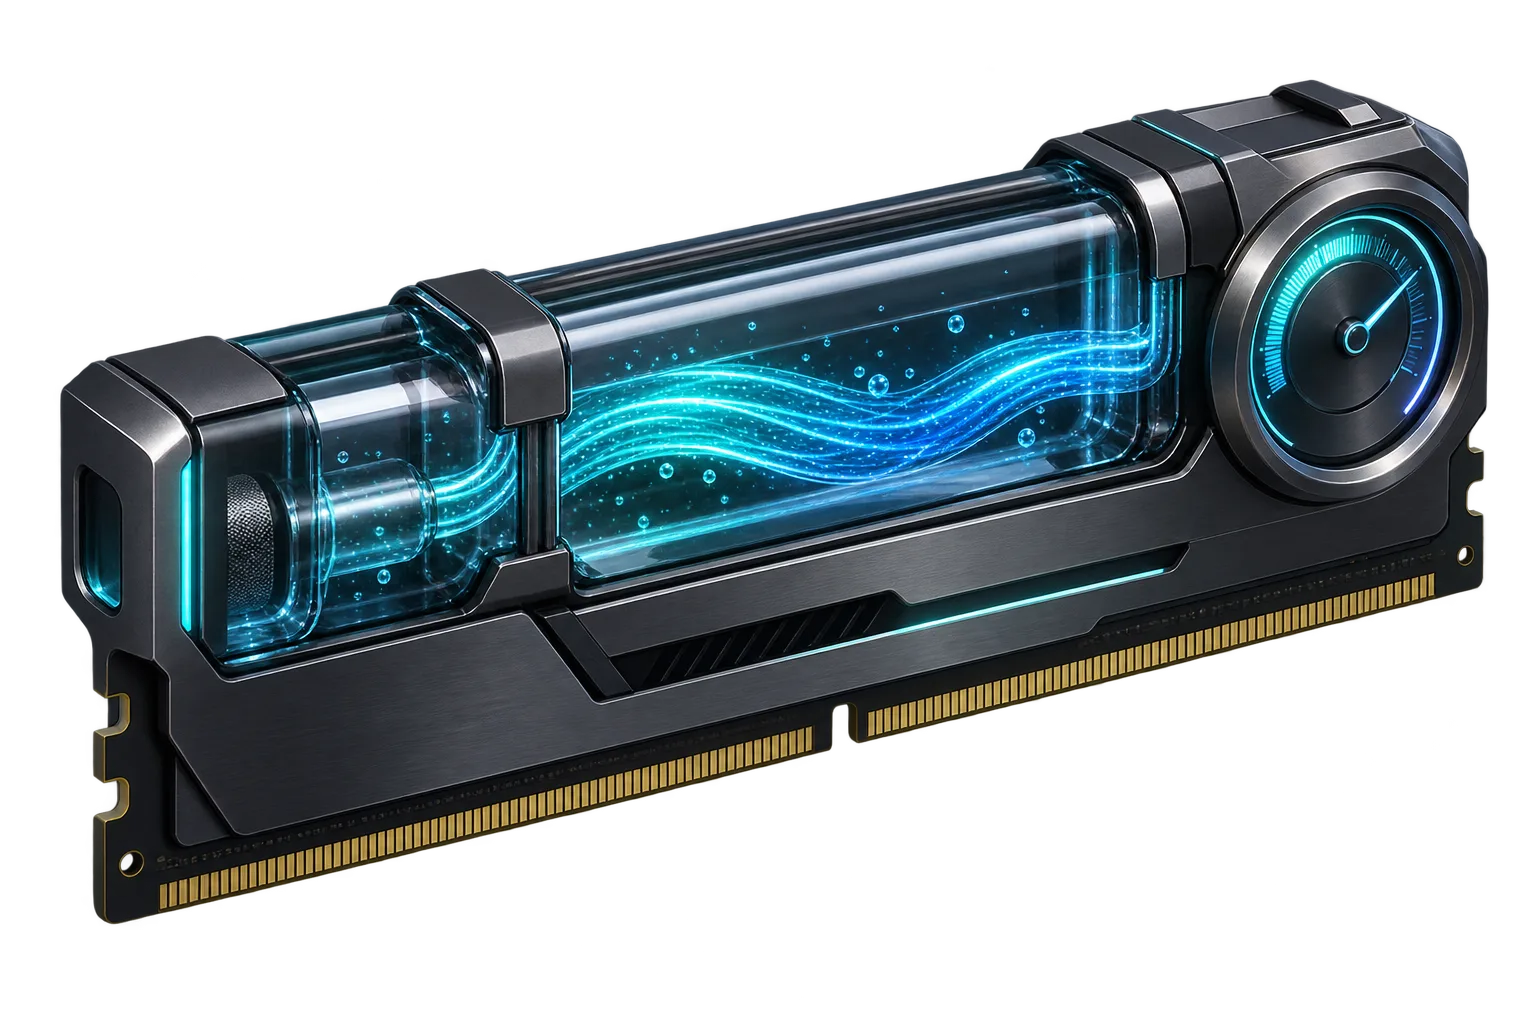
Graphite memory module with glass cache reservoir
FEATURE 18 / 35

Memory and kernel view

Inspect RAM buffers, cache and kernel-related health signals from the active host.

  • Understand pressure before adjusting memory settings
  • Keep live vitals visible beside diagnostic context
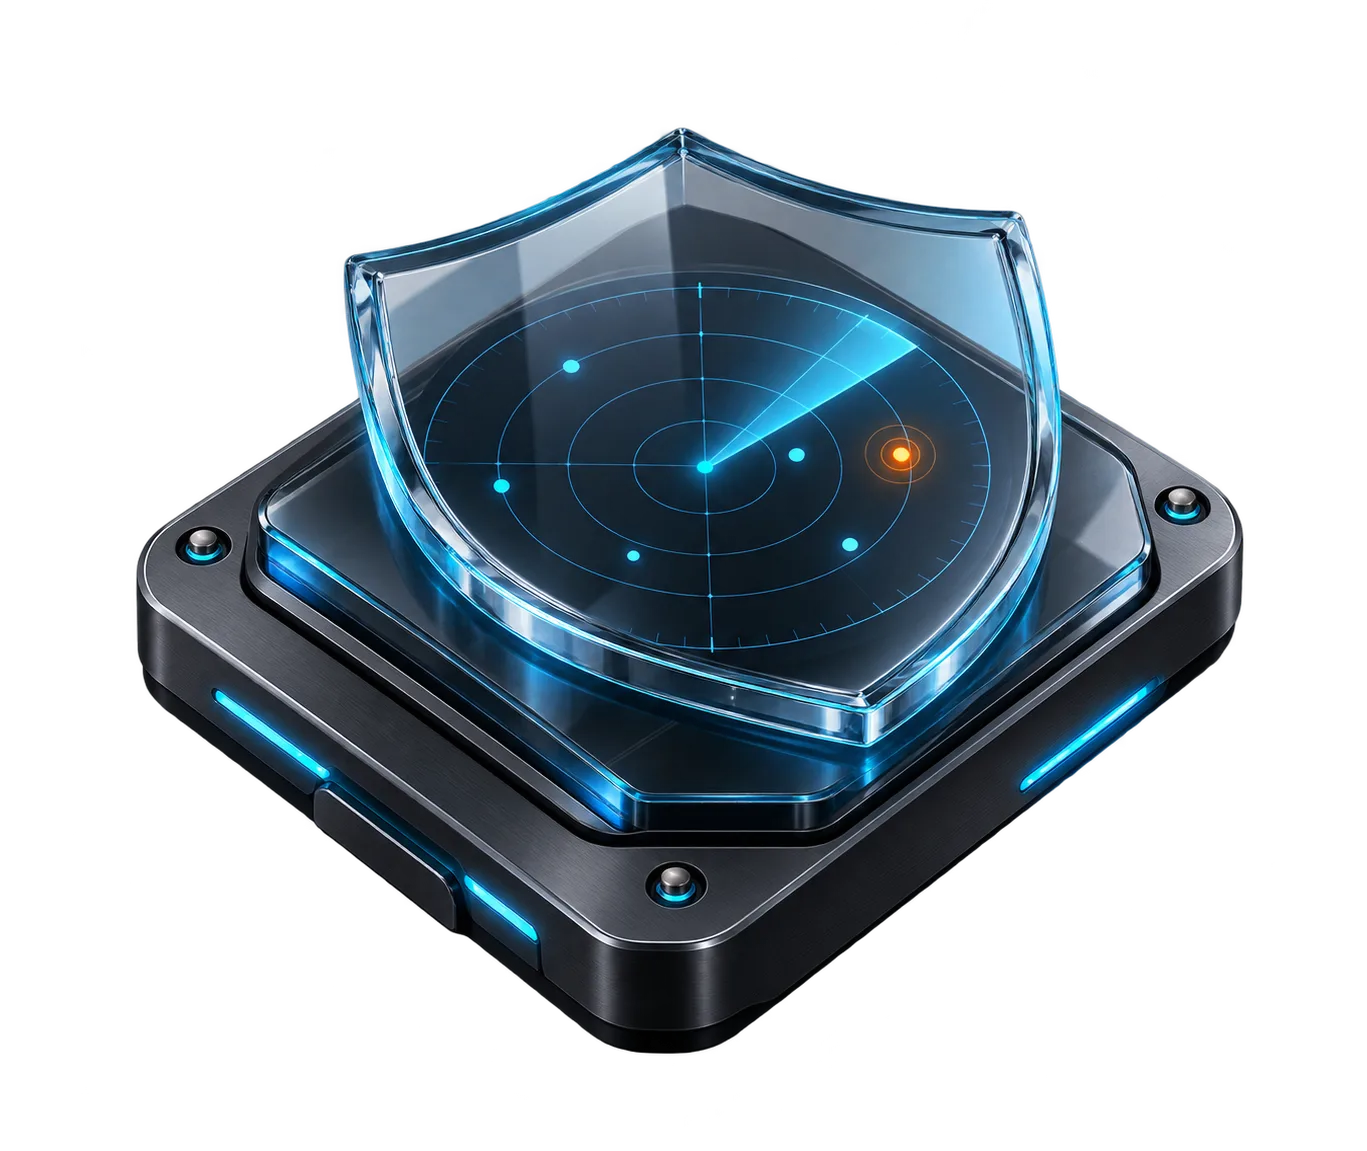
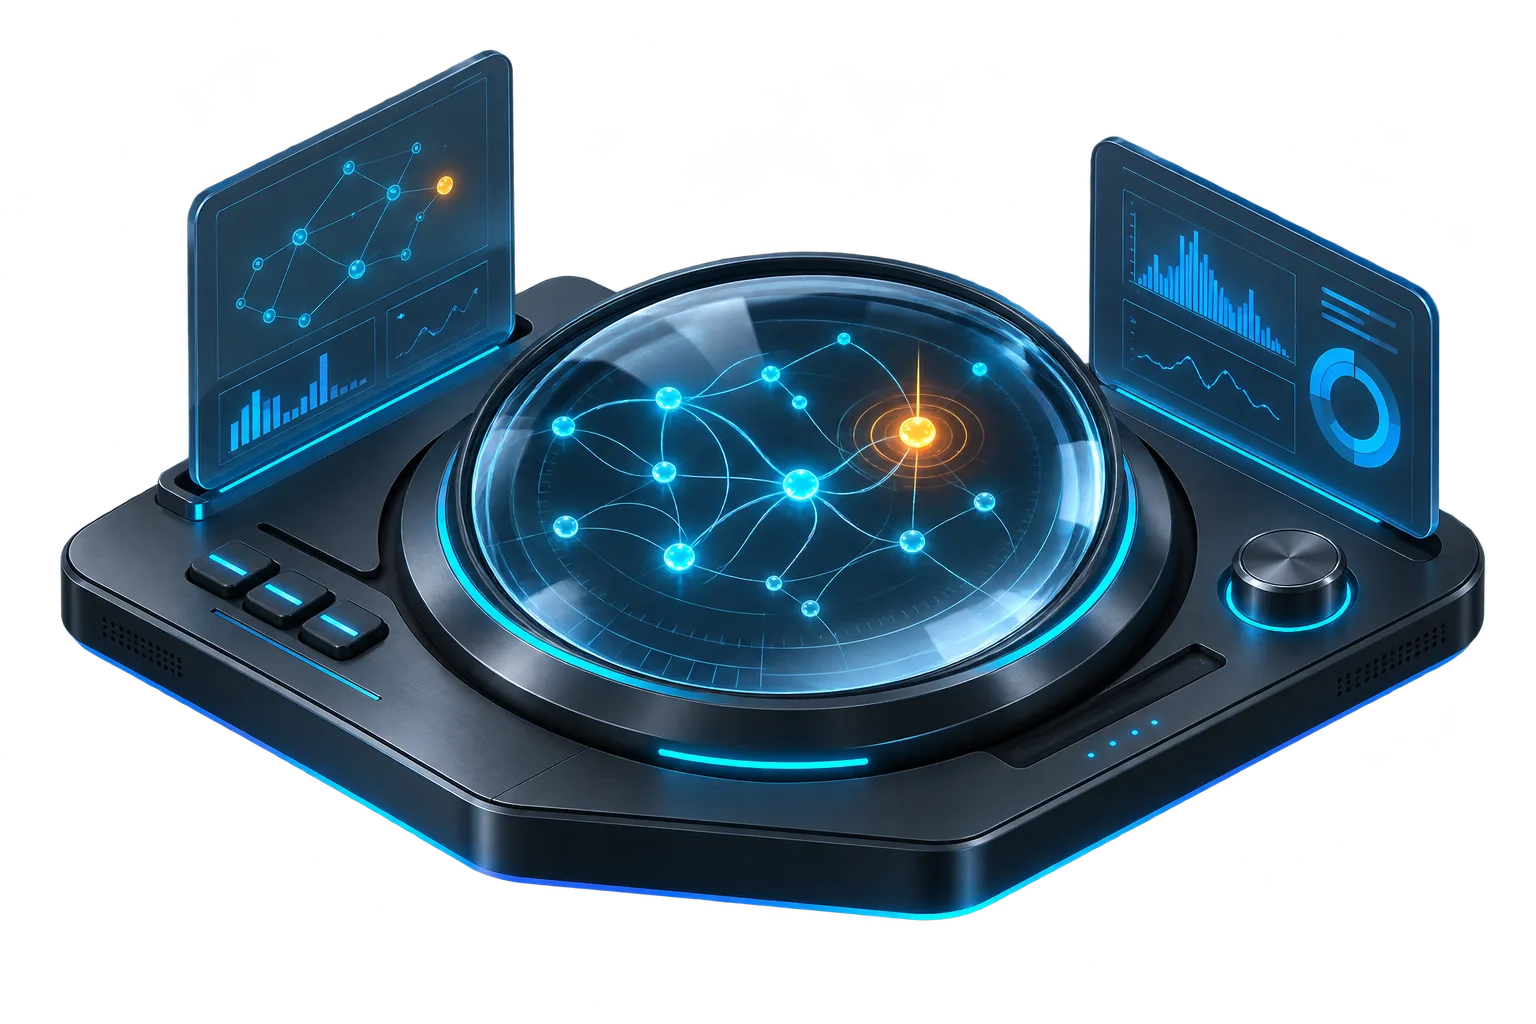
Graphite radar plate with protective shield
FEATURE 19 / 35

Read-only security radar

Surface risky SSH settings, firewall state and exposed listeners as findings with evidence and guidance.

  • Security findings are reported, not automatically repaired
  • Separate observed state from external exposure claims
Forensic inspection lens marking one anomaly
FEATURE 20 / 35

Suspicious activity indicators

Inspect signals such as executables running from temporary paths and download-and-run startup patterns.

  • Present evidence for manual review
  • A signal alone is not labeled as proof of malware
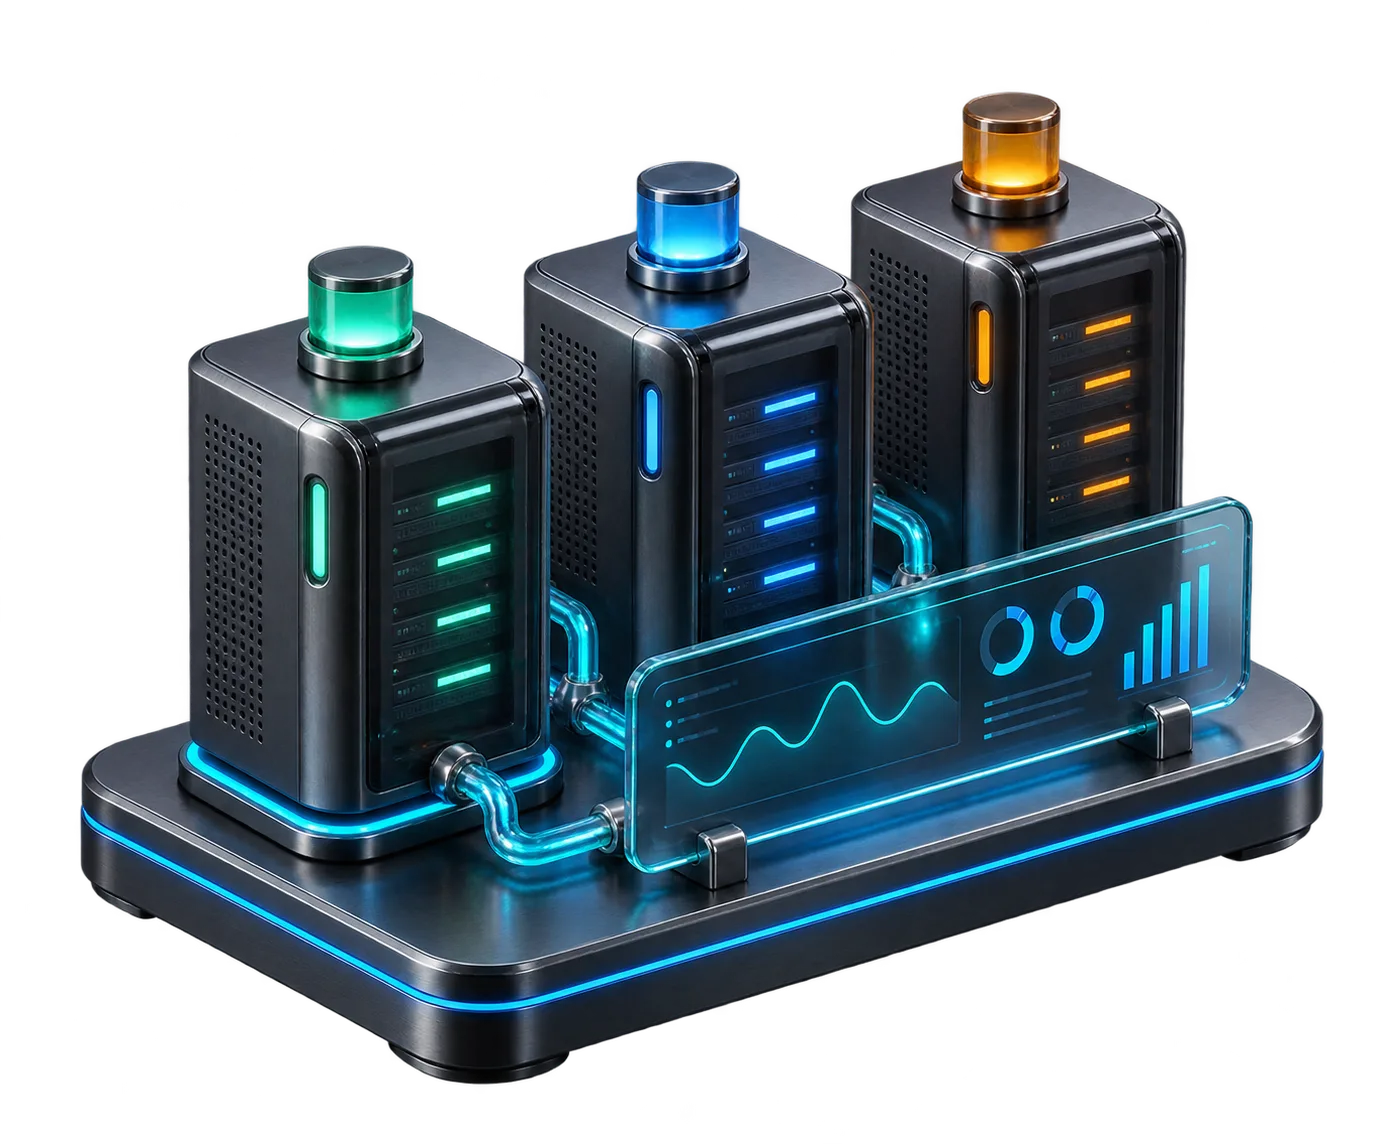
Graphite service units with status lights
FEATURE 21 / 35

Service and process anomalies

Find failed services, zombie processes and other operational clues in a focused diagnostics view.

  • See names and descriptions of failed units
  • Prioritize findings alongside system health
Graphite automation clock with service nodes
FEATURE 22 / 35

Scheduled care

Choose a maintenance schedule and inspect the actions that run under the AutoCare plan.

  • Daily, weekly and monthly schedule options
  • Execution logs give a record of completed care
06 / Infrastructure tools

Your daily stack, in one place.

Inventory common packages and work directly with containers, data stores and web gateways.

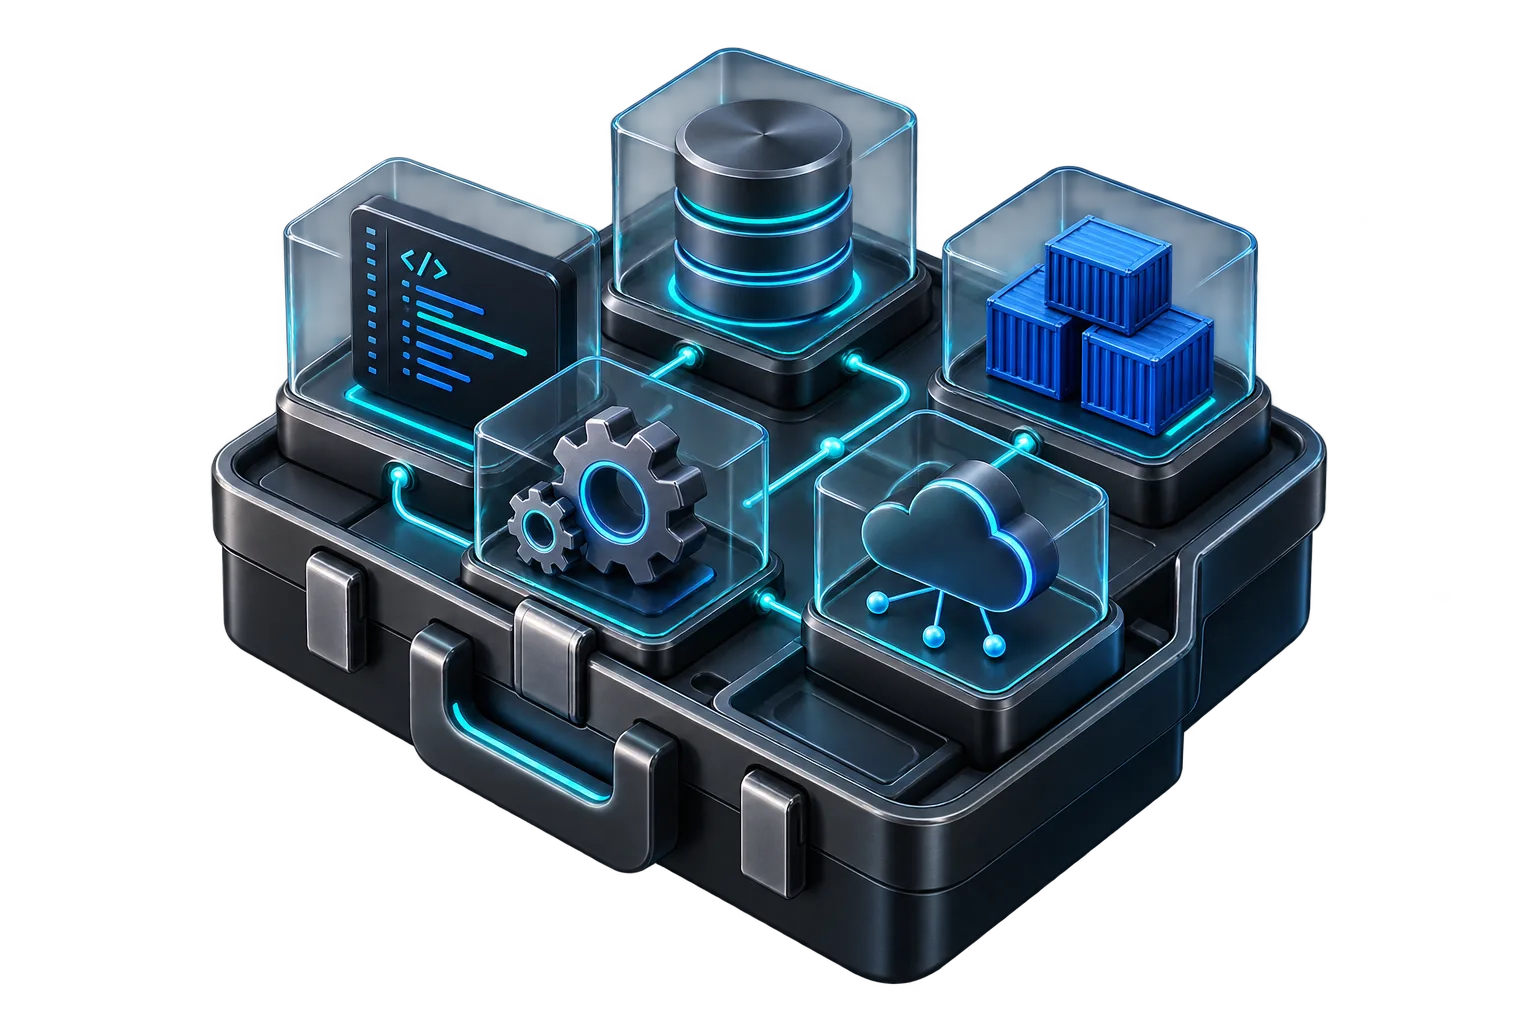
Graphite catalog of developer tools
FEATURE 23 / 35

Install and remove tools

Inventory installed developer tools and common infrastructure packages with versions and detectable disk size.

  • Discover Redis, PostgreSQL, MySQL, Kafka, Docker and more
  • Quick install options appear for missing catalog entries
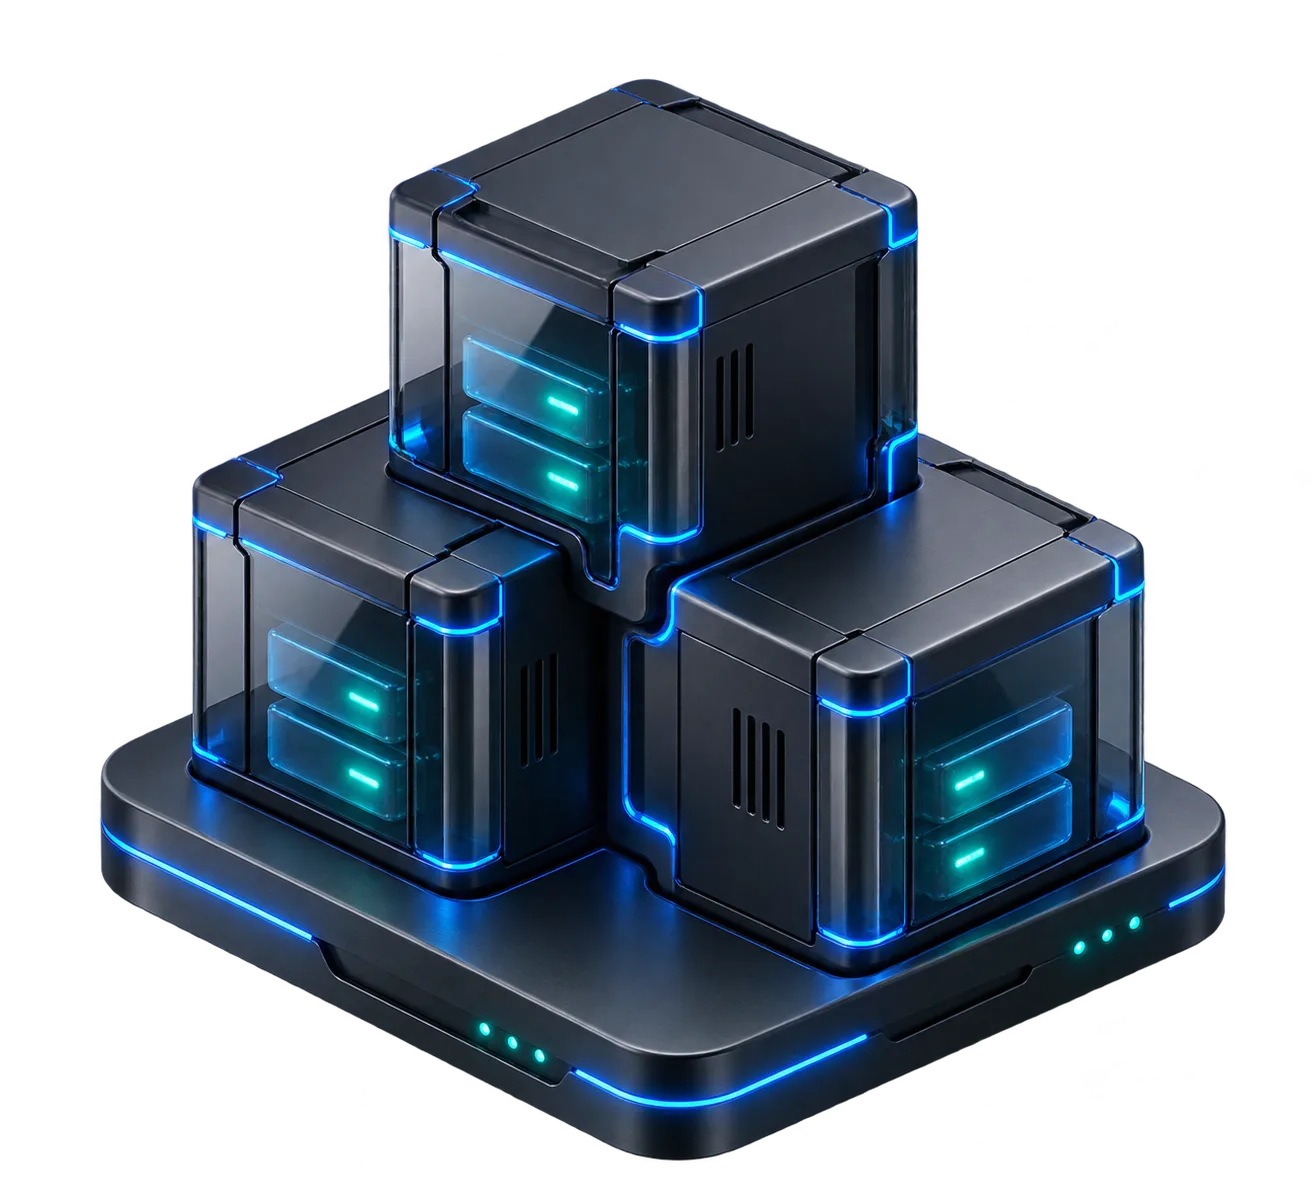
Stacked graphite application containers
FEATURE 24 / 35

Docker and Compose

Inspect containers and discovered Compose files, with logs and lifecycle controls in context.

  • Start, stop, restart or inspect containers
  • Find and edit Compose definitions from the server workspace
Graphite Redis key-value cache sculpture
FEATURE 25 / 35

Redis Studio

Search keys with multiple match modes, inspect values and manage TTL from a dedicated workspace.

  • Browse string, hash, list and set data
  • Edit a selected key with context in view
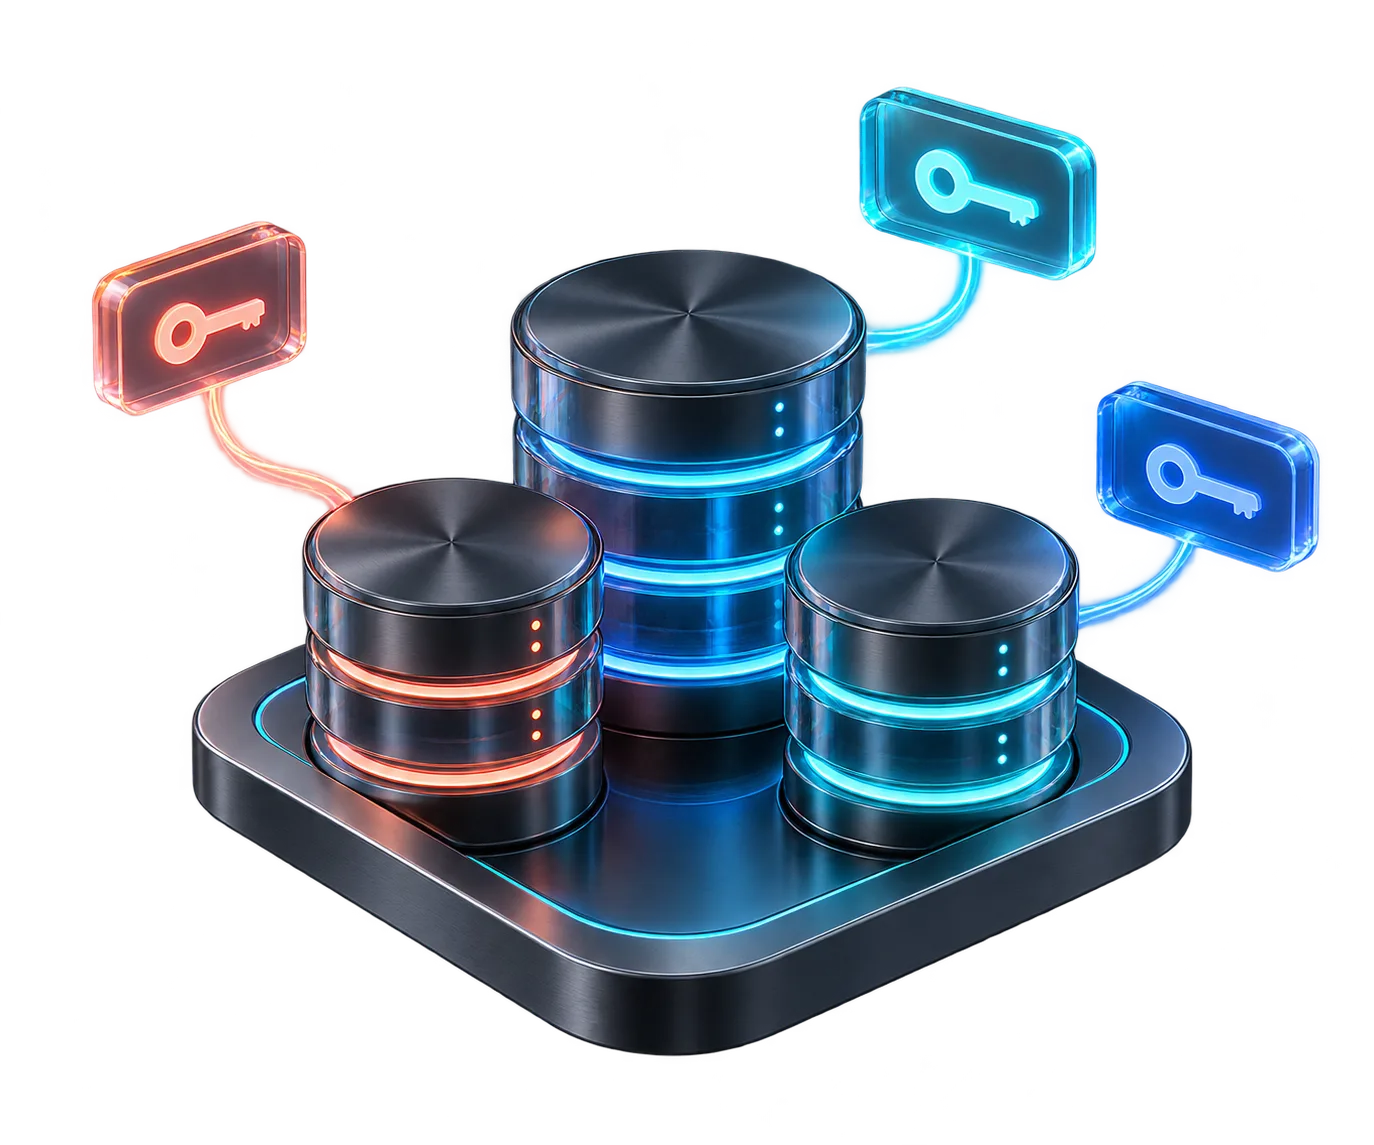
Graphite PostgreSQL data cluster
FEATURE 26 / 35

PostgreSQL explorer

Connect directly, inspect schemas and page through data without destabilizing the table view.

  • Explore columns, keys and indexes; browse table data in pages of 50
  • Use bounded text previews and validated read-only SQL queries
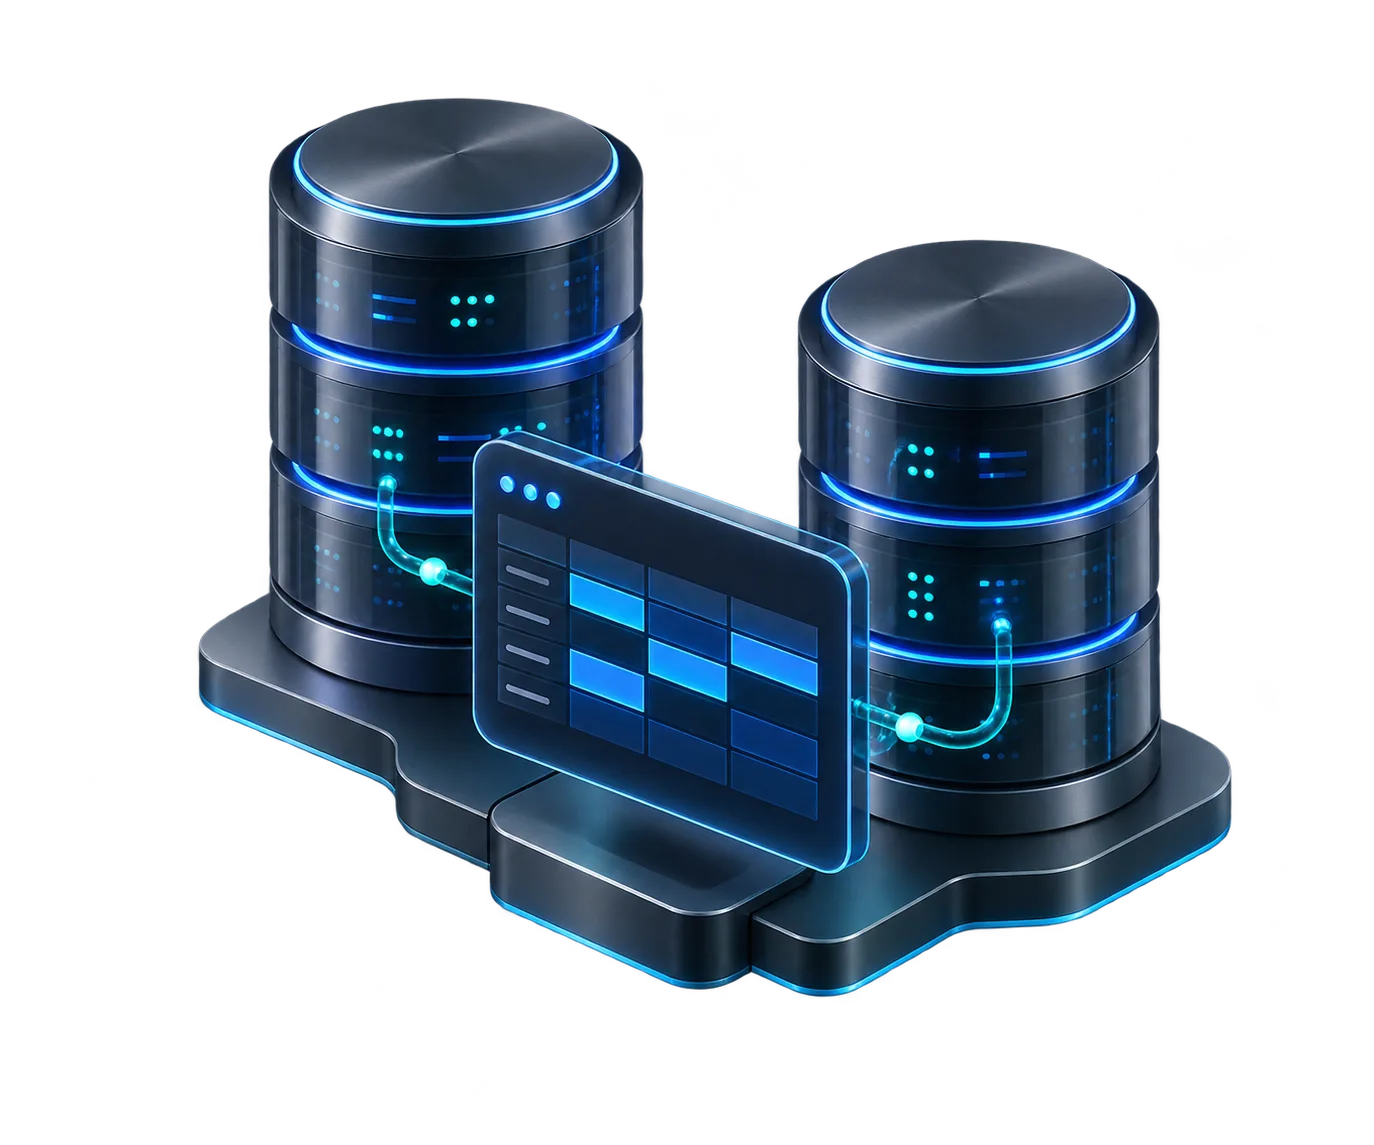
Graphite relational database cylinders
FEATURE 27 / 35

MySQL and MariaDB

Use the same database workspace for MySQL-family servers, from table previews to exports.

  • Keep JSON, XML and HTML previews from stretching table cells
  • Export the current returned result to CSV, JSON or SQL text
Graphite reverse-proxy gateway with traffic paths
FEATURE 28 / 35

Nginx traffic intelligence

Turn access logs into daily request, response, route, bot and upstream insight.

  • Full-day aggregates alongside bounded detail samples
  • Inspect status groups, top routes and error patterns
Graphite virtual host routing gateway
FEATURE 29 / 35

Nginx configuration

Explore virtual hosts and configuration files, edit deliberately and test before reload.

  • Inspect domain, proxy and SSL context
  • Validate with nginx -t before applying a reload
Nginx gateway with multiple visitor and application paths
FEATURE 34 / 35

Visitor sessions and interaction timelines

Inspect visitor paths, sources and available device context, with optional interaction timelines and replay-style inspection.

  • Filter visitor records and inspect the selected session
  • Rich interaction data requires explicit tracking setup; log coverage and retention affect results
07 / Keyboard-first flow

Move at the speed of thought.

The command palette keeps servers, snippets and recent work one shortcut away.

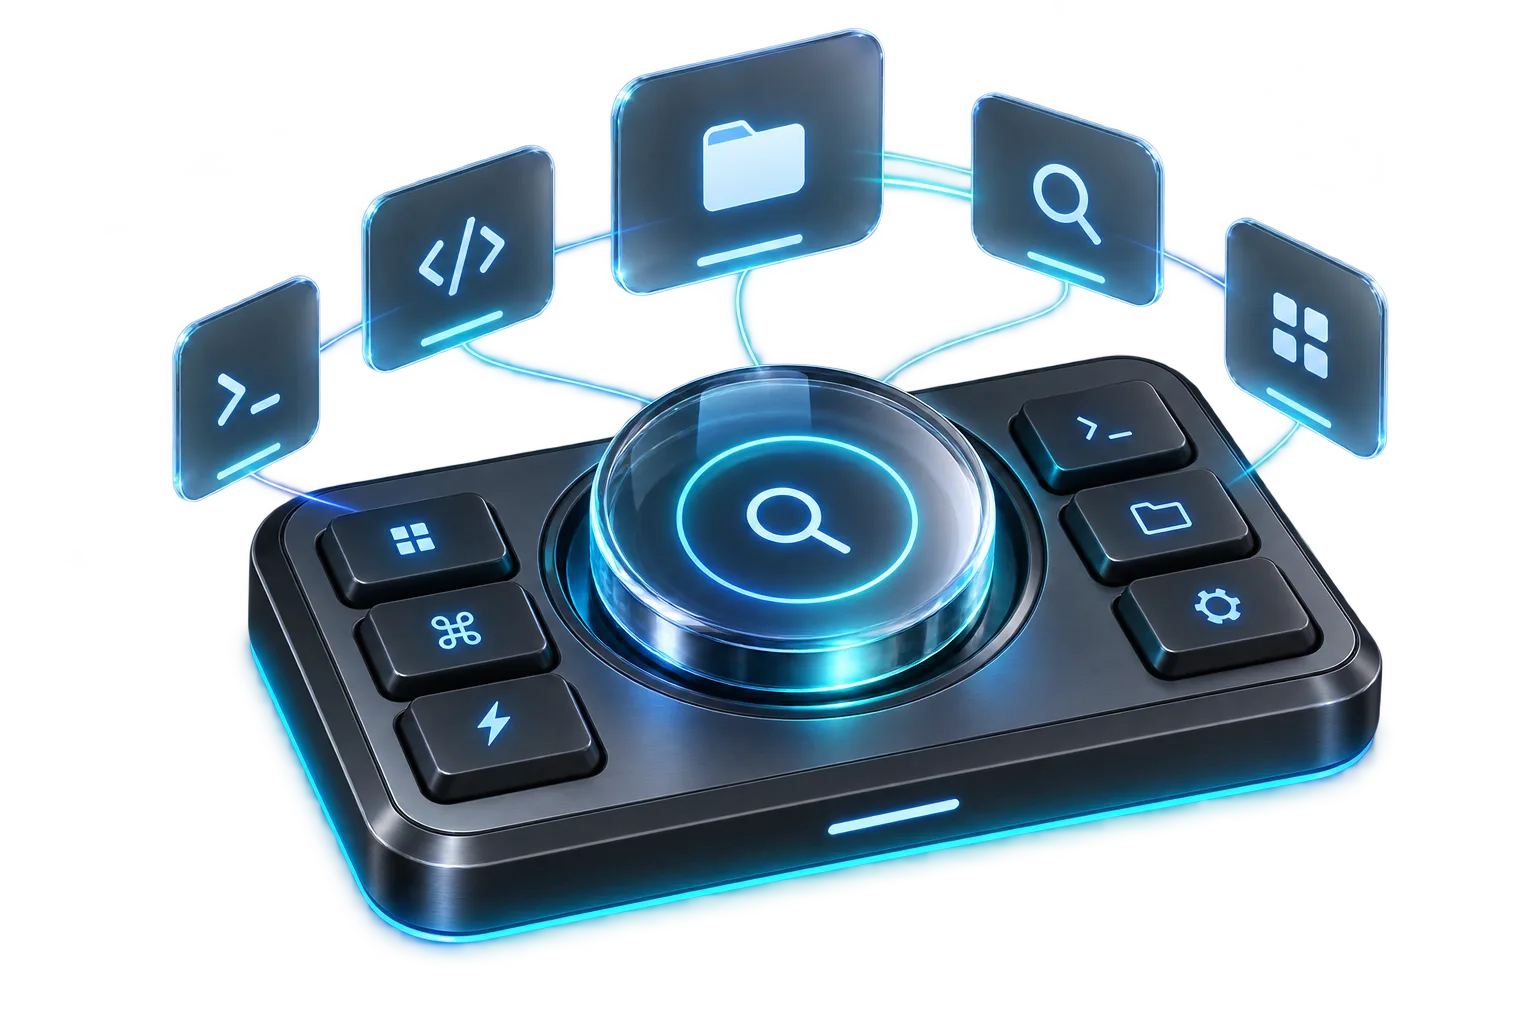
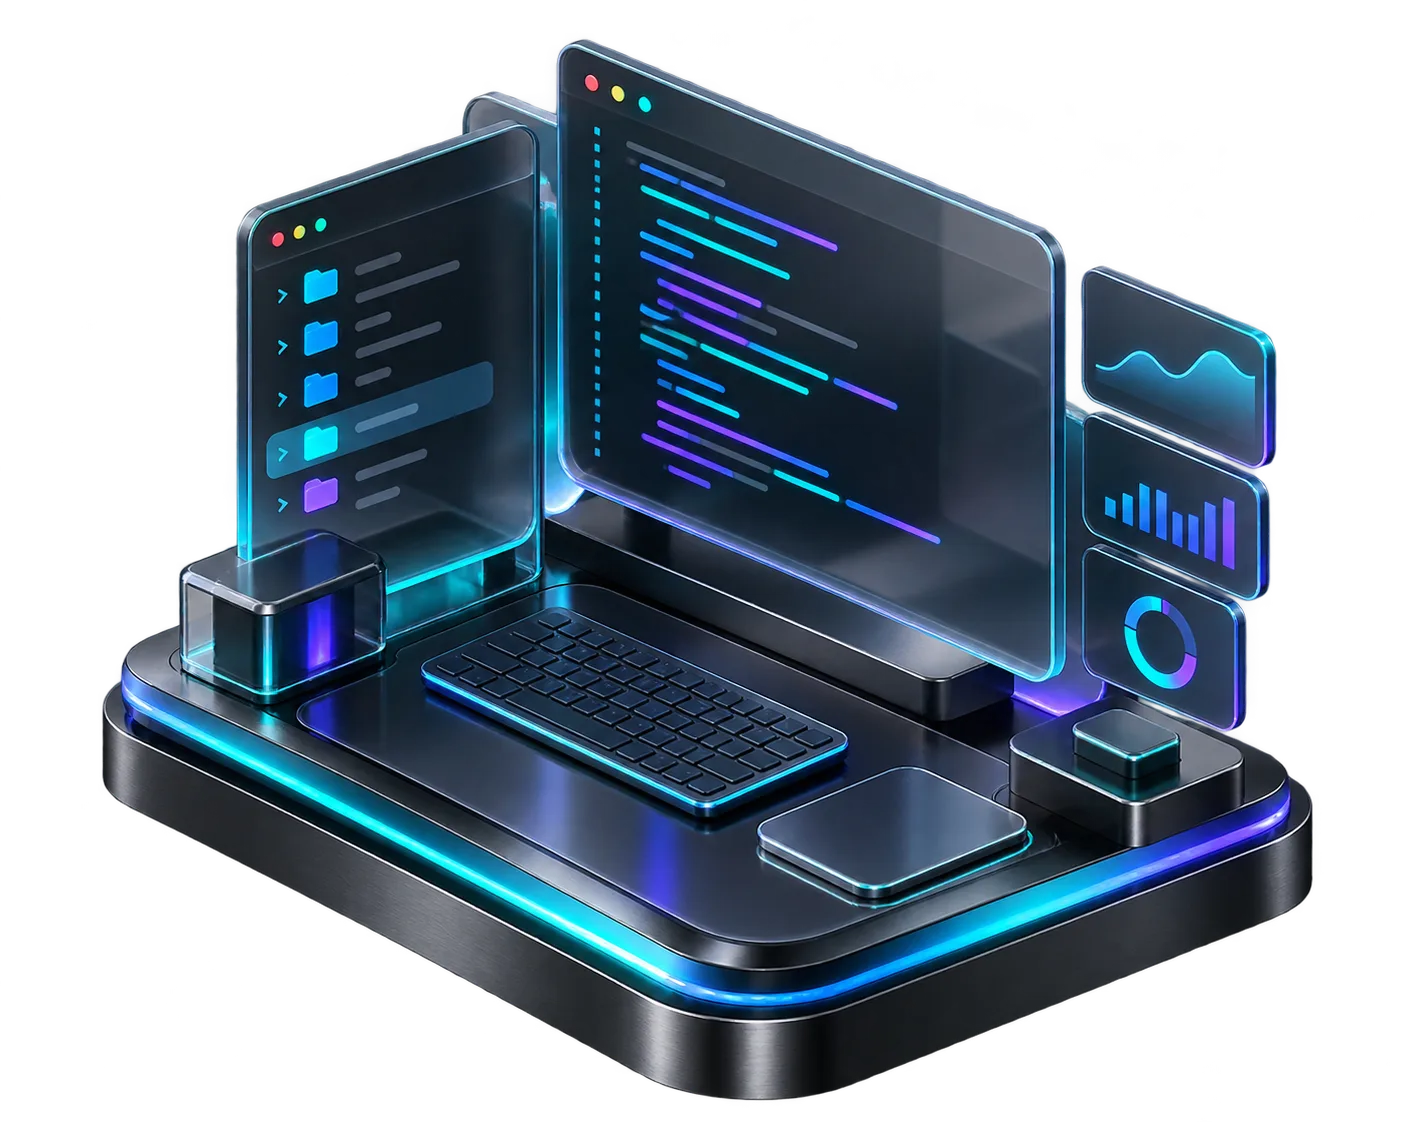
Graphite command launcher with floating shortcut cards
FEATURE 30 / 35

Command palette and snippets

Search servers and saved commands with ⌘K, then insert or execute the right action quickly.
  • Categorize and favorite reusable snippets
  • Keep recent commands accessible in the sidebar
Graphite workspace controls and adjustable command cards
FEATURE 35 / 35

Interface scale and language options

Adjust the interface to your screen and keep terminal appearance preferences close to your workflow.

  • Scale interface controls from 90% to 150%
  • English and Turkish options are available; some tool-specific text still needs translation polish
03 / SECURITY MODEL

See the risk.
Keep control.

Security Radar and suspicious activity scans report evidence for review. They do not silently change firewall rules, SSH policy or other security settings.

01

Observed configurationRisky SSH settings, firewall state and exposed listeners are surfaced as findings.

02

Suspicious behaviorTemporary-path execution and download-and-run patterns are signals for investigation.

03

Protected credentialsSaved secrets use macOS Keychain-backed encryption through Electron safeStorage.

Explore Security Radar ↗
Graphite security radar symbol
SECURITY RADAR / SAMPLE VIEWREAD ONLY
Findings for reviewContext before intervention
03 SIGNALS
01
SSH configurationAuthentication policy and access paths
REVIEW
02
Network exposureListeners and firewall state
REVIEW
03
Process indicatorsUnusual execution paths
REVIEW
No settings changed. Findings are not proof of compromise.
04 / METHOD

From signal to decision.

A clear sequence for working on a remote host.

01

Connect

Open a local shell or authenticated SSH session and keep the host in view.

02

Inspect

Read files, processes, ports, logs, databases and health findings in context.

03

Act

Edit a file, manage a container, run a saved command or clean selected residue.

04

Verify

Use status, logs, config tests and rescans to confirm what changed.

PRODUCT NOTES / CURRENT CAPABILITIES & FUTURE IDEAS

What you can do now.
What could come next.

Discover the details behind the workspace, its current boundaries and ideas for future development.

Read product notes
AVAILABLE TODAY

Connection errors with a next step

Distinguish rejected credentials, key problems, DNS failures, refused connections, timeouts and shell access restrictions. Keep the original failure visible and edit the connection from the error screen.

Explore this feature
AVAILABLE TODAY

Follow a growing remote log

Start follow mode in the remote editor to read appended bytes while keeping the displayed tail bounded. Editing is disabled while following; stop following to return to file editing.

Explore this feature
AVAILABLE TODAY

Nginx visitor and interaction context

Inspect visitor sessions, page paths, referrers and available browser/device context. Optional tracking adds interaction timelines and replay-style inspection when the required data is collected.

Explore this feature
FROM THE JOURNAL

Know your tools.
Understand your systems.

Practical field guides for your Mac terminal and the infrastructure behind it.

Explore all 15 guides
05 / FAQ

Before you connect.

Details about the workspace, security model and infrastructure coverage.

What is All in Term?

All in Term is a macOS terminal and server operations app combining local shell sessions, SSH, SFTP, monitoring, System Care, Docker, Redis, databases and Nginx tools.

Does All in Term support private-key SSH?

Yes. It supports password authentication and OpenSSH, PEM, RSA and ED25519 private keys, including passphrases.

Can I inspect security findings without automatically changing my server?

Yes. Security Radar and suspicious activity scans are read-only. They report findings and evidence for your review.

Can I manage files without leaving the terminal workspace?

Yes. The SFTP manager follows your server context and supports browsing, transfer, remote editing and local-to-remote folder comparison.

Which database and infrastructure tools are included?

The app includes PostgreSQL and MySQL-family database views, Redis keys, Docker and Compose controls, Nginx analytics and configuration management, plus a developer tool inventory.

Is All in Term free?

All in Term is currently free. Access starts automatically when you create an account. No payment details are needed now; pricing may change in the future.

All in Term workstation illustration06 / ALL IN TERM

Stay in command.
See the whole system.

Explore the product, its connected workflows and every capability in detail.

MACOS · APPLE SILICON + INTEL · CURRENTLY FREE · NO PAYMENT DETAILS NEEDED