Follow remote logs without losing the signal: bounded views, fresh bytes and rotation
Use a bounded live log view to inspect fresh events, preserve context and recognize gaps, rotations and incomplete evidence during an investigation.
A growing application log is useful because it preserves a sequence, but that same growth can make a file awkward to inspect remotely. Reopening a large file repeatedly spends attention and transfer effort on history you may not currently need. Following a bounded recent view offers a different operating pattern: watch new evidence, connect it with one deliberate action and retain only the material needed for the investigation. This guide uses a fictional release check to explain All in Term's remote editor follow mode. The transfer and event graphs use explicitly invented values to illustrate scope; they are not measured speed or bandwidth claims.
Start with the question and the correct log source
Name the operation you want to observe before following a file. For a release check, that might be one request to a recently changed route. Identify which service handles the operation and which file records its events. A large central log may contain several unrelated processes. A quiet application file may exclude reverse proxy failures. Selecting the source is an important part of the reasoning, not merely a navigation step.
Confirm the remote host and full path in the file workspace. Note the server timezone and the approximate start time of the check. If the application writes to container output instead of a regular file, use the relevant container log workflow rather than assuming a familiar filesystem path exists. All in Term has both file inspection and container views, so choose the view that matches the service's actual logging arrangement.
Keep the observation connected to an operation.
- 01
Source
Confirm host, path and time.
- 02
Follow
Read the bounded recent view.
- 03
Observe
Perform one relevant operation.
- 04
Record
Keep the evidence and its limits.
Conceptual workflow · follow each check before moving to the next step.
Separate an editable document from a live observation
A configuration editor and a live log follower have different responsibilities. The first manages an intentional text change; the second observes a file that another process is changing. Mixing those roles can create confusion about unsaved content and which version is on the server. Save or resolve local edits before starting a follow operation. A clear mode boundary helps prevent an accidental overwrite while investigating another process's output.
All in Term makes the live-follow view read-only and requires following to stop before returning to editing. Use that distinction deliberately. If you need to change configuration after reading a log, finish the observation and identify the separate configuration file. Do not edit the active log to remove an alarming line. The log is evidence about behavior; the application or service configuration is usually where the cause must be investigated.
| Need | Useful approach | Boundary |
|---|---|---|
| Edit configuration | Stop following and use the editor | Confirm the intended file before saving |
| Watch fresh application events | Follow the relevant growing file | Visible tail is not complete history |
| Investigate an earlier incident | Inspect retained historical records | Rotation and retention affect coverage |
| Inspect container output | Use the container log workflow | A regular host log file may not exist |
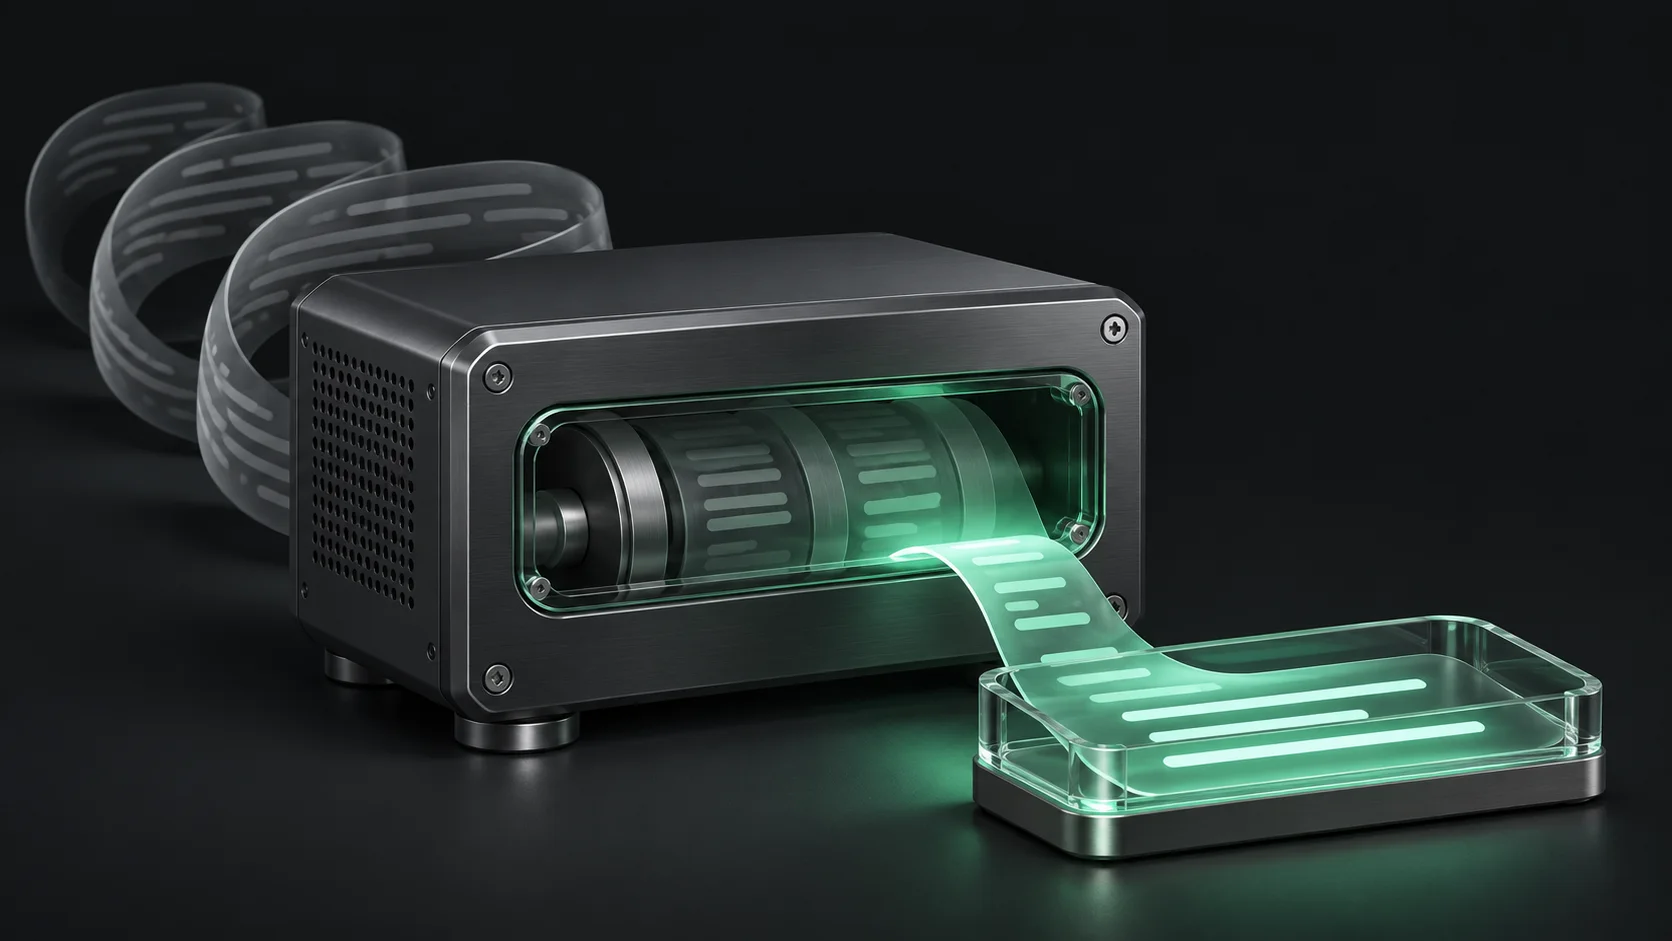
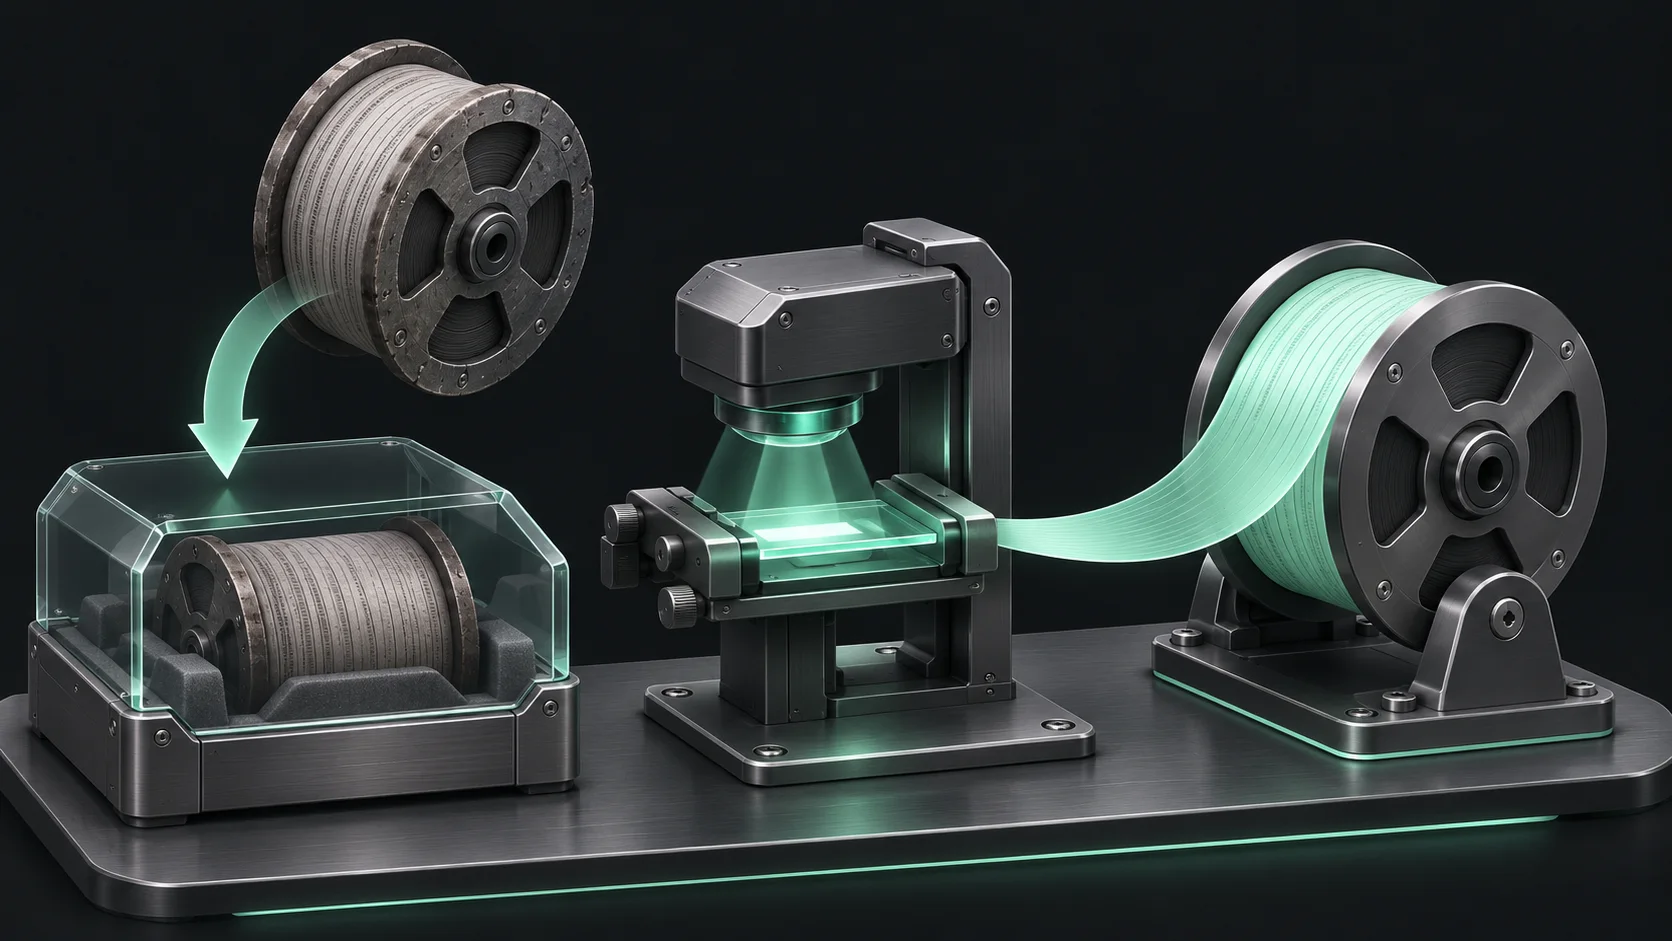
Follow new evidence without reloading the entire file.
The spool represents accumulated history; the illuminated window represents the recent text needed for a live investigation. It is not a benchmark.
Bound the view
Keep the visible tail readable while the remote file continues to grow.
Read the delta
Incremental reads target appended bytes rather than repeatedly requesting the complete historical file.
Understand what a bounded window includes
A bounded view keeps a manageable amount of recent text visible while the source continues to grow. That is useful for readability, but it means the current screen is not a complete history. Earlier lines can leave the view, and the relevant event may have happened before following began. Record the observation window when discussing what the log shows. Absence from the visible tail is not proof that an event never occurred.
The remote editor reads appended content incrementally during following rather than requesting the entire historical file on every refresh. The first graph below compares two invented transfer patterns: six complete reads of a hypothetical hundred-megabyte file versus six one-megabyte increments. It illustrates why request scope matters, not the exact behavior or savings of every real workload. Initial reads, rotation, encoding and the rate of writes can change the observed transfer.
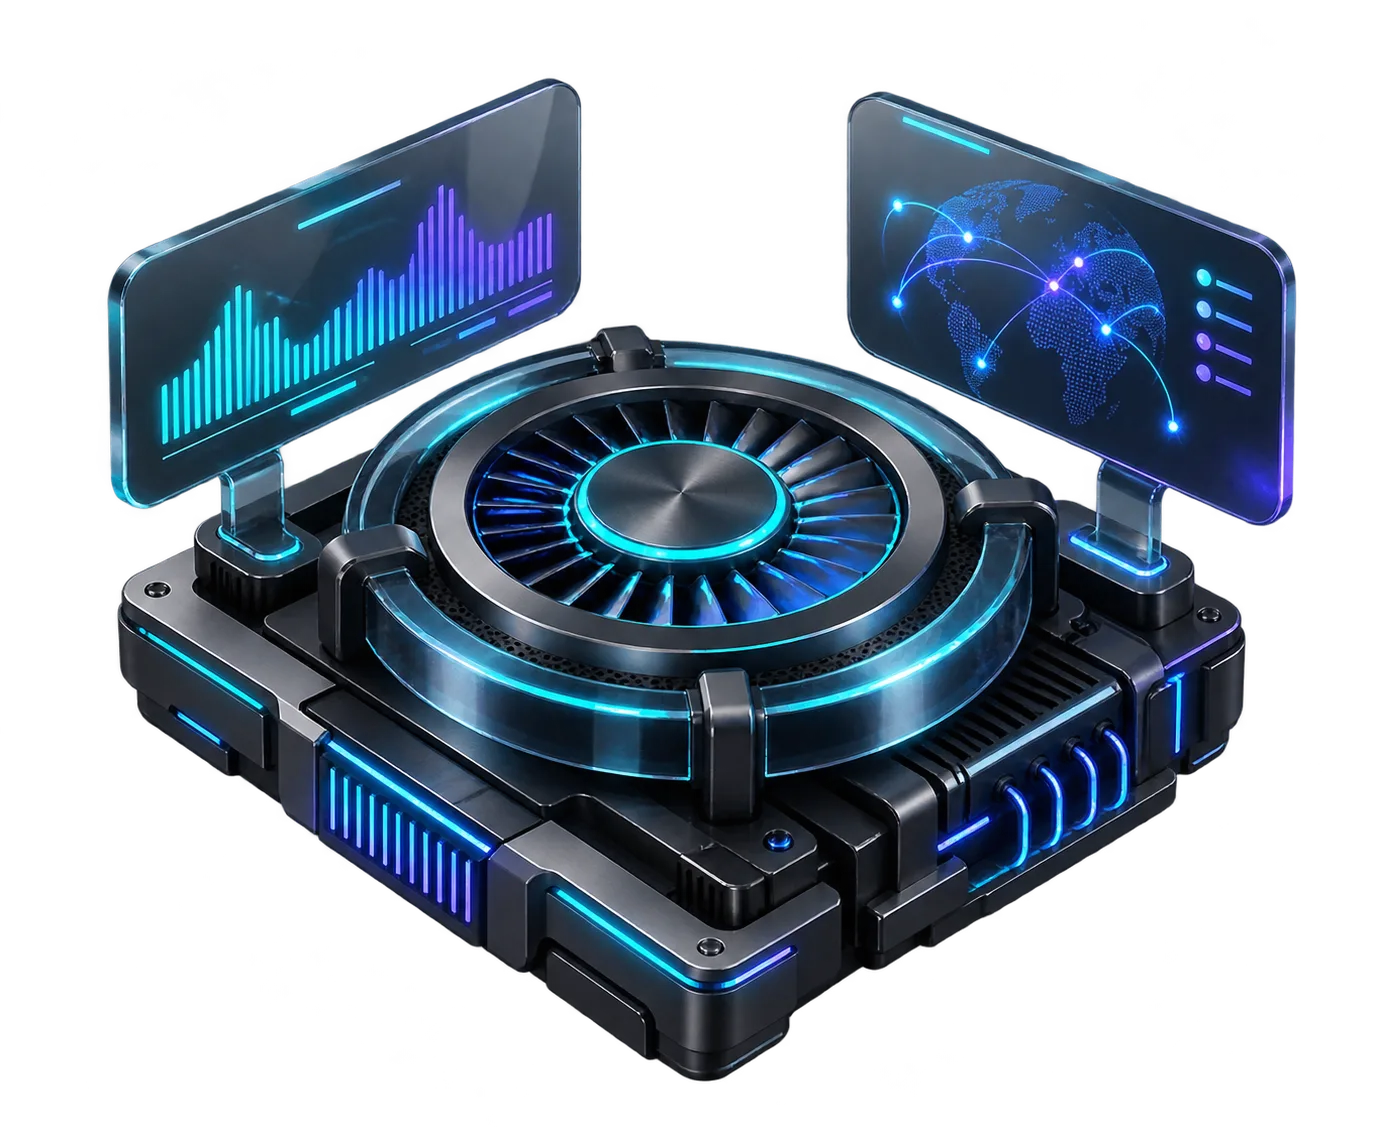
Fresh evidence needs a clear observation window.
Bounded views improve readability but cannot establish what happened outside the observed and retained records.
Concept illustration, not an application screenshot.Connect one action with the fresh events it produces
Perform a small, authorized operation and watch the new messages that follow. For a web investigation, use a known request and note the approximate time. Look for identifiers that the application already provides, such as a request or job reference. Similar timestamps alone are not a guarantee that two messages describe the same operation, particularly when several workers write to the same source.
Read the surrounding events before deciding which line explains the failure. A warning may be routine, while an earlier connection problem may be the real clue. Capture a minimal redacted excerpt with the source path and time window in your normal incident record. Avoid forwarding the entire log without considering its contents. Logs can contain customer information, internal paths or accidental secrets even when the application is not intended to record them.
Two invented transfer patterns for six observations
Unit: MiB requested in the example. Synthetic example values, not production measurements.
Bars start at zero and share the same linear scale. Exact values are printed alongside each bar.
Treat rotation and truncation as continuity questions
Logs can be renamed, replaced or shortened while a service continues to run. A reader following one underlying file can therefore behave differently from a reader repeatedly opening a path. GNU tail documents different following modes for this reason. The correct behavior depends on the tool and the writer. Do not assume that every follower automatically bridges every rotation pattern without a gap.
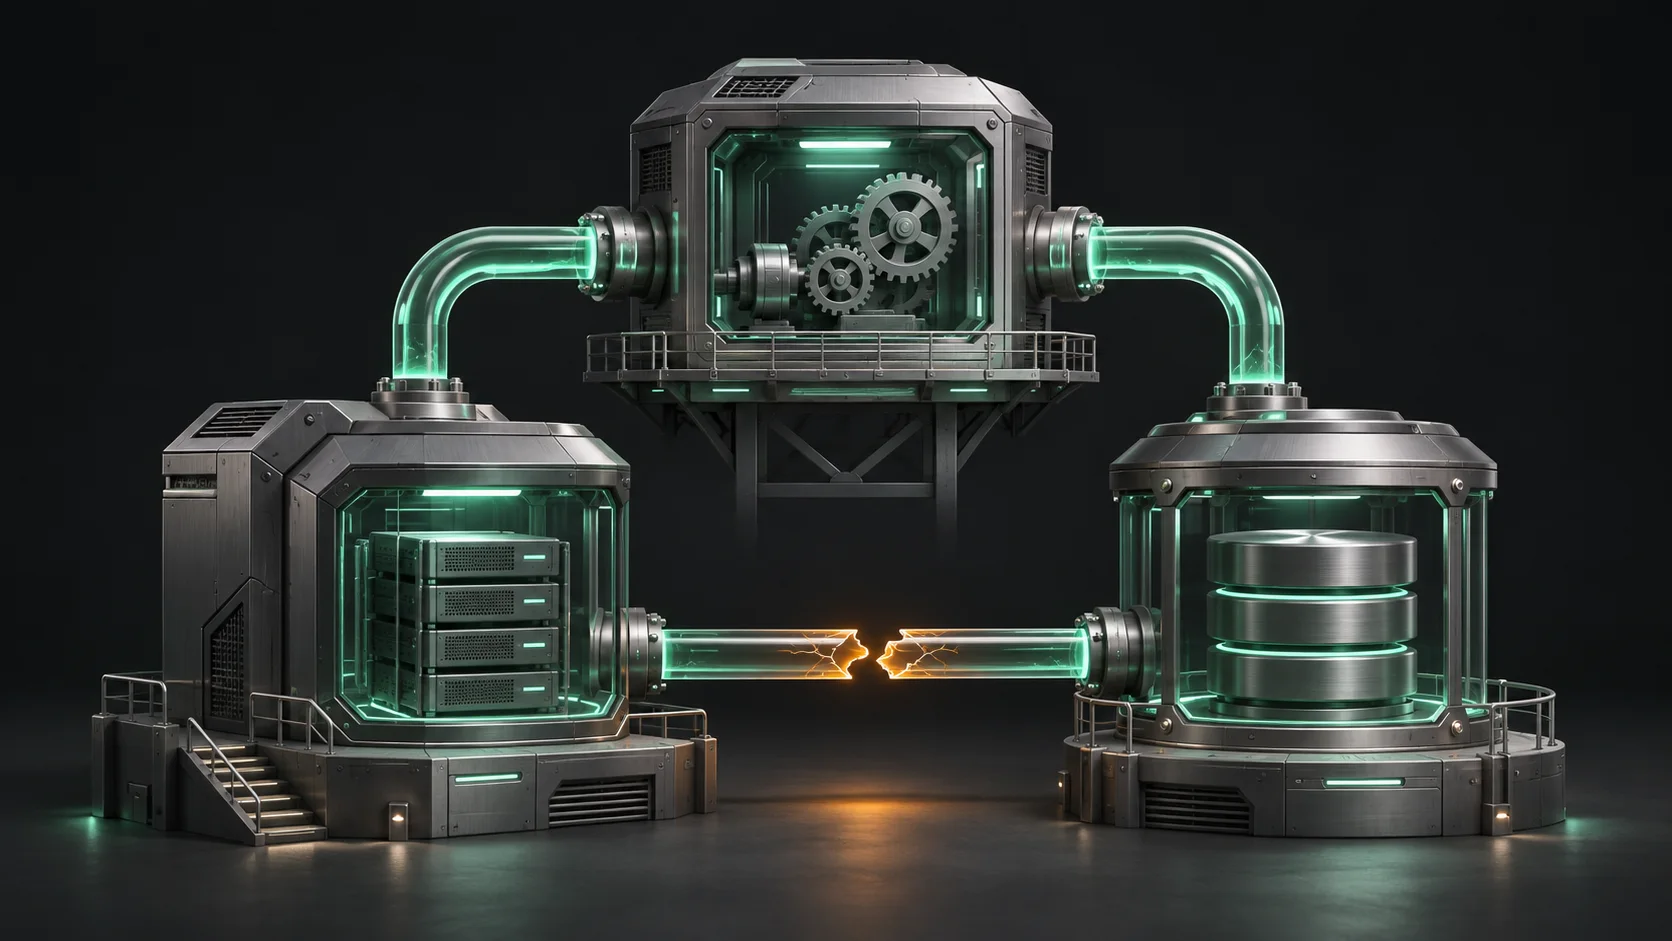
If a view becomes unexpectedly quiet, compare the current path, service activity and file state before concluding that the application stopped. Reconfirm the source and restart the follow workflow deliberately if needed. Preserve any uncertainty about continuity in the report. The second illustration shows separate old and active log spools to make this distinction concrete: a familiar path name does not, on its own, explain the entire sequence of records you observed.
Keep the observation proportional to the workload
Following a very noisy source can still consume network, rendering and human attention even when the view is bounded. Choose the narrowest useful source and stop following when the question is answered. If a service writes huge documents into individual messages, a small line count may still represent substantial content. Use an appropriate application logging policy and a focused inspection rather than treating the live viewer as a reason to retain everything indefinitely.
When several events matter, summarize them with their meaning and the limits of the sample. The second synthetic chart groups a fictional twelve-minute observation into event categories. Its numbers describe a made-up example, not an expected error mix. A visual summary helps organize an explanation, but the original representative messages remain necessary when another operator needs to verify why a category was assigned or a conclusion was reached.
Treat rotation as a change in the evidence source.
Separate spools represent an old log and its replacement. A path name alone does not explain which stream a reader is currently following.
Check continuity
A silent view after rotation needs a source check before it becomes a claim that the application is inactive.
Reconfirm the path
Compare the current log location, observed time and application event before resuming the investigation.
End the follow session with a verified conclusion
After a justified correction, repeat the original operation and inspect fresh evidence from the same relevant sources. Confirm the actual behavior rather than relying solely on the absence of a previous error line. If the application succeeds while the log is silent, explain how the operation was verified and whether the selected source is known to record successful events. Different logging policies can make silence mean different things.
Stop following when the investigation is complete, then retain a concise record of the source, window, action and result. If continuity was interrupted, state that limitation. All in Term's follow mode makes a growing remote file easier to observe, while the surrounding terminal and file tools preserve host context. Use that convenience to make the reasoning clearer: identify the source, watch fresh bytes, connect them with an operation and keep only the evidence needed to support the conclusion.
Inside the application: a scoped local example
This capture uses the shipped UI component in an isolated renderer. The host, files and service data are demonstrations, not a production session. It illustrates the surrounding workflow; it does not verify every service-specific command in this guide.
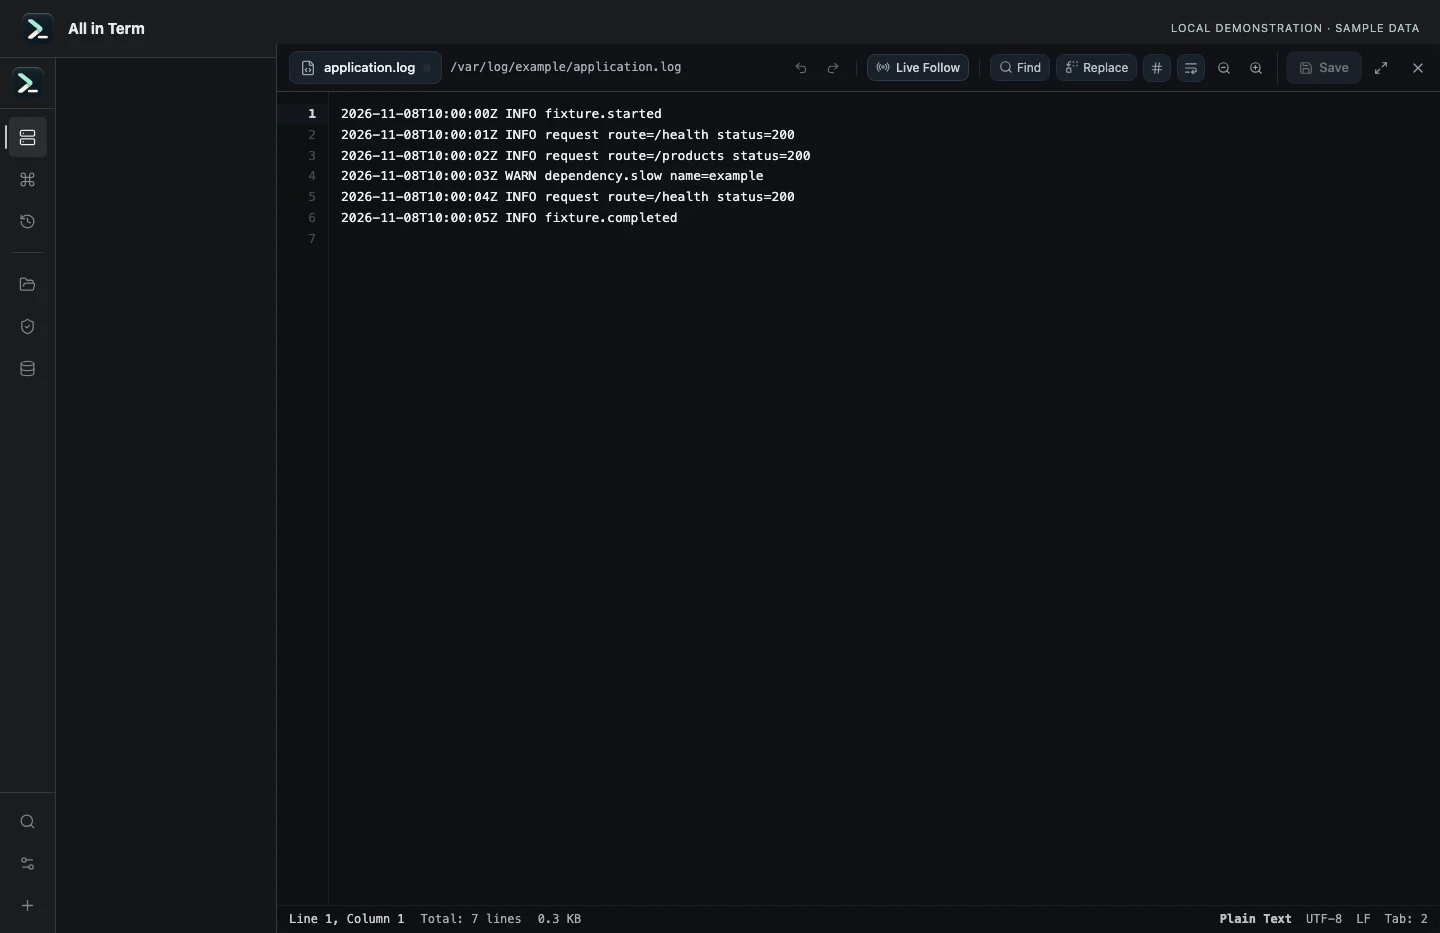
Remote editor component displaying a locally created six-line example log. Captured 2026-11-08. Open the image to inspect details.
Read the last three fixture log lines
Executed the installed tail utility against a six-line local example file. This is not a production log.
Executed check
tail -n 3 application.logRecorded output
2026-11-08T10:00:03Z WARN dependency.slow name=example
2026-11-08T10:00:04Z INFO request route=/health status=200
2026-11-08T10:00:05Z INFO fixture.completed
Recorded 2026-11-08. Executed locally against synthetic fixtures. No production host or database was contacted. Read the recorded checks.
Events in a fictional twelve-minute observation
Unit: sample events. Synthetic example values, not production measurements.
Bars start at zero and share the same linear scale. Exact values are printed alongside each bar.
A small command example
Read the comments, confirm the active host and adapt any example names to your environment before running commands.
# GNU/Linux terminal alternative, after confirming the path
# Review file content for sensitive data before sharing
tail -n 50 -F /var/log/example/application.log
Further reading
Official documentation for the underlying tools. The workflows and synthetic examples above are editorial guidance, not performance claims.