
Read Nginx traffic like an operator: requests, bots, routes and upstream errors
Turn access and error logs into a useful investigation with honest totals, clear route grouping and careful bot attribution.

A traffic chart is useful only when you understand what it counts. A panel showing five hundred records might describe the newest detail rows, a bounded sample, or the entire day. An error log can contain hundreds of upstream connection failures without implying that every HTTP request failed. A user agent can claim to be a search crawler without proving who sent the request. Good Nginx analysis keeps those distinctions visible. This guide walks through a fictional traffic incident and explains how to connect daily totals, response classes, routes and upstream evidence into a decision you can defend.
Define the observation window and source
Start with the hostname, date range and timezone. Then identify which access and error logs belong to that virtual host. A server may write several sites into one access log, use custom formats, rotate files during the day or sit behind a CDN. Each condition affects the interpretation. A statement such as requests increased today needs a precise source and a comparison window before it can guide an operational change.
Distinguish complete aggregates from detail views. It is reasonable for an interface to display only a manageable number of recent rows while calculating totals from the available daily records. The label must make that difference clear. If the source itself is incomplete, say so. Missing rotated logs, unreadable files or a parser that cannot recognize the configured format can all reduce coverage. A smaller number should not silently become a claim about the entire day's traffic.
Keep the request and its evidence connected.
- 01
Client
Sends a request for a route.
- 02
Nginx
Handles or proxies the request.
- 03
Upstream
Application produces its response.
- 04
Evidence
Compare access records and error events.
Conceptual workflow · follow each check before moving to the next step.
Separate HTTP outcomes from error log messages
Access logs describe completed requests according to the configured fields. Error logs describe events encountered while handling work. They are related evidence, but their record counts are not interchangeable. A repeated upstream connection refusal can explain a class of failed requests, yet the error entry count does not provide the denominator needed for a request failure rate. Calculate that rate from the same request population and time window used for the total.
For the fictional incident in this article, imagine twelve thousand access records, with three hundred responses in the 5xx class. That produces a 2.5 percent 5xx share for this synthetic dataset. Separately, the error log may contain a group of repeated connection-refused messages. Inspect timestamps, routes and upstream destinations to connect those messages with the affected requests. Do not label all twelve thousand requests as errors merely because every row in the error-log view describes a failure.
| Response class | Requests | Share |
|---|---|---|
| 2xx | 10,800 | 90% |
| 3xx | 600 | 5% |
| 4xx | 300 | 2.5% |
| 5xx | 300 | 2.5% |
Follow traffic through the gateway.
The gateway stands for Nginx and the outgoing paths represent upstream services. The amber break illustrates a possible connection problem, not a real incident.
Start with the request
Choose the host, route and time window before comparing outcomes. Different logs may describe different populations.
Inspect the upstream
A failing path suggests checking the configured destination and the listening service. The diagram itself does not establish a cause.
Group errors by meaning without erasing evidence
Raw error messages often differ only in client addresses, timestamps or request paths. Grouping them can reveal an operational pattern, such as an upstream connection refusal or a timeout while waiting for a response. Keep the original examples available so that a useful category does not become a replacement for the underlying facts. The group should help you choose the next inspection, not hide the variation that could explain the cause.
A connection refusal suggests checking whether the configured upstream is listening at the expected address and port. A timeout suggests a different investigation into responsiveness, load or dependency behavior. Permission failures around a static path point elsewhere again. These are starting hypotheses, not automatic diagnoses. Compare the timing with deployments and service changes. In All in Term, Nginx analytics and configuration views can keep this evidence close to the connected host without requiring the chart itself to make the decision.

A route is more than a raw URL.
Choose an explicit grouping rule. Route families help reveal patterns, while exact requests preserve the detail needed to investigate them.
Concept illustration, not an application screenshot.Turn URLs into routes that answer a question
A raw request URL may contain a path, a query string and identifiers that produce thousands of distinct values. Grouping every unique URL can bury the route that matters. Decide whether your investigation needs exact requests, normalized paths or route families. For a product page, requests to different product identifiers may belong together. For a cache investigation, query parameters may be essential and should not be discarded without thought.
Avoid carrying sensitive query values into screenshots or exported examples. Explain the grouping rule beside the chart so that a reader understands whether a bar represents one exact path or several related endpoints. The example route chart below uses simple path families and fictional request counts. Its purpose is to illustrate how a heavily used endpoint can dominate the workload even when it produces relatively few errors. Traffic volume and failure share should be reviewed together.
Traffic by route family in the fictional incident
Unit: requests. Synthetic example values, not production measurements.
Bars start at zero and share the same linear scale. Exact values are printed alongside each bar.
Treat bot labels as claims until verified
User-agent strings are useful for grouping traffic that claims to come from Googlebot, YandexBot, an OpenAI crawler or another automated client. They are not proof of identity because a requester can choose its own string. Label such charts as user-agent-based classification unless you have performed the relevant verification. Keep unknown traffic visible rather than forcing every request into a familiar provider's name.
For operational analysis, the first useful question may be which routes a claimed crawler visits and how much work those requests generate. Compare request volume, response codes and timing. Avoid blocking an entire category based solely on a recognizable label. A bot chart should support a policy decision grounded in your site's needs and the observed behavior. If verification matters, consult the provider's current official guidance before treating a claimed identity as authenticated.
Read timing fields in their logging context
Timing analysis requires a log format that actually records the measurements you need. Inspect the Nginx configuration before assuming a field exists in historical logs. A chart cannot reconstruct a measurement that was never written. When planning better logging, decide which questions matter, how long records should be retained and which fields may expose sensitive information. A small documented format is easier to maintain than a large collection of fields nobody interprets.
Once suitable measurements are available, compare like with like. A slow route with tiny traffic may deserve different treatment from a modest delay affecting most requests. Averages can conceal a minority of very slow responses, so review distributions or individual slow examples when your tooling provides them. Keep the measurement definition beside the result. The purpose is to identify the next place to inspect, such as an application handler or dependency, rather than to declare a cause from a single latency number.

Request records and error events tell different stories.
The broad channel represents the request population and the separate tray represents error events. Their visual sizes are conceptual and do not encode a measured failure rate.
Use the right denominator
Compute response shares from the same set of access records used for the total. Error log entries are not a request denominator.
Preserve detail
Grouped patterns help navigation, while original messages and timestamps help explain what happened. Keep both available.
Validate the change against the original symptom
Suppose you find that a deployment changed the upstream port while the application continued listening on its previous endpoint. Review the configuration and the actual listener before editing. Use the service's validation procedure before activation, then check fresh requests and logs afterward. A passing configuration test establishes that Nginx accepts the configuration; it does not establish that the application is healthy or that users can complete their task.
Compare the same route, host and observation window after the change. Record whether the upstream failures stopped and whether the request outcome improved. If the evidence is mixed, preserve that uncertainty and investigate further. A useful Nginx dashboard makes the evidence easier to navigate while retaining the boundaries between requests, log events, identities and samples. Those boundaries are what keep an attractive visualization from becoming a misleading operational conclusion.
Inside the application: a scoped local example
This capture uses the shipped UI component in an isolated renderer. The host, files and service data are demonstrations, not a production session. It illustrates the surrounding workflow; it does not verify every service-specific command in this guide.
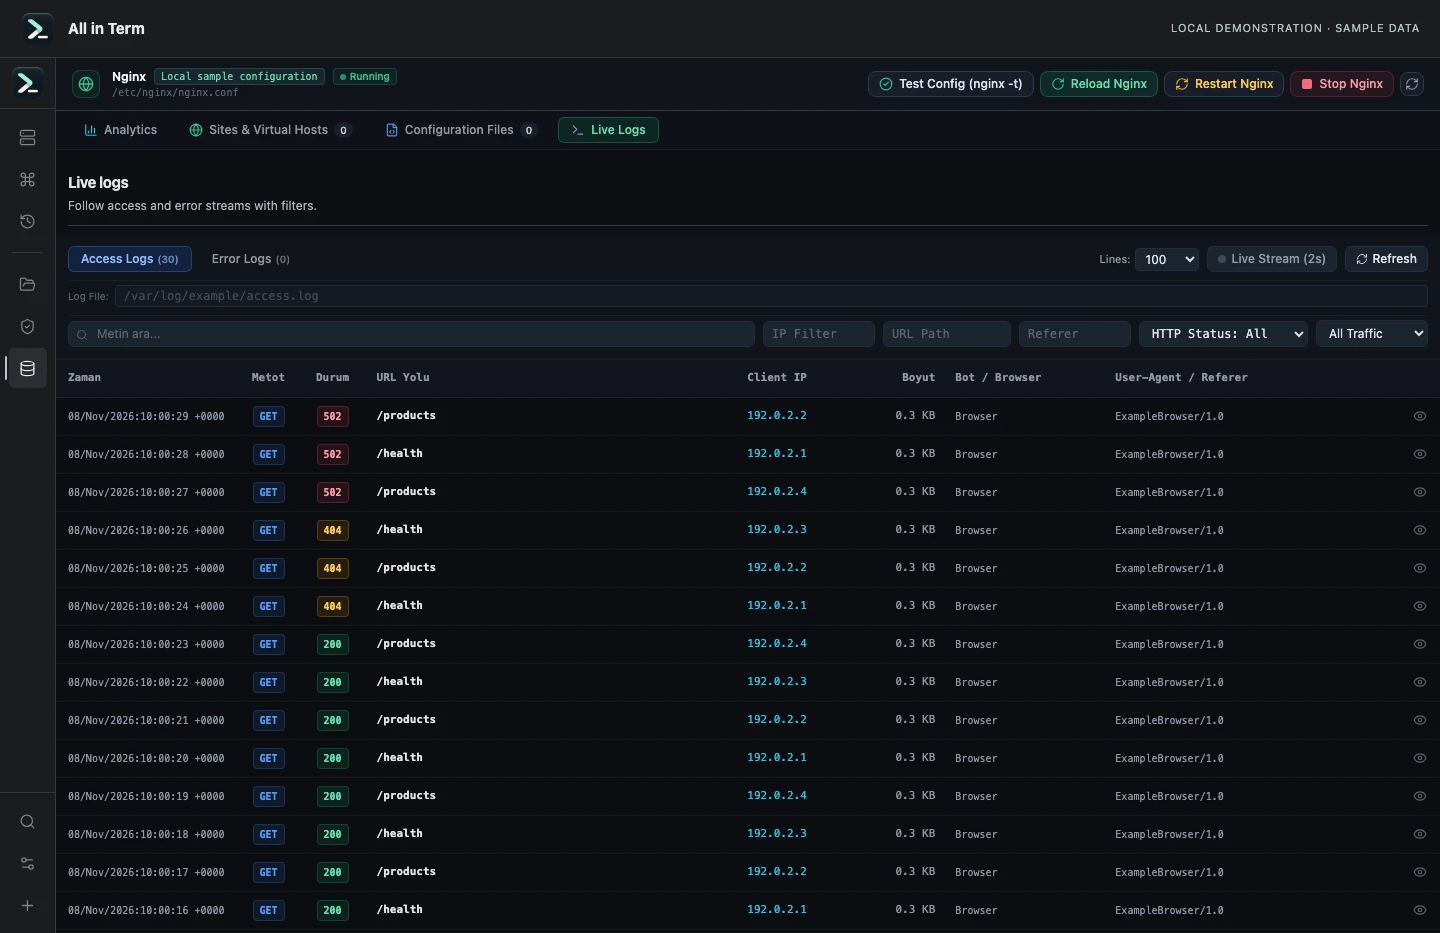
Nginx component displaying results parsed from 30 synthetic request records; no live Nginx server was inspected. Captured 2026-11-08. Open the image to inspect details.
Parse a known access-log fixture
Executed the current Nginx log parser against 30 synthetic access records and one synthetic error record. These counts describe only that fixture.
Executed check
parseRawNginxLogs(accessFixture, "access", examplePath)Recorded output
Parsed access records: 30
200 responses: 24
404 responses: 3
502 responses: 3
Parsed error records: 1
Recorded 2026-11-08. Executed locally against synthetic fixtures. No production host or database was contacted. Read the recorded checks.
A small command example
Read the comments, confirm the active host and adapt any example names to your environment before running commands.
# Validate configuration before an intended reload
# Requires the appropriate server permissions
nginx -t
Further reading
Official documentation for the underlying tools. The workflows and synthetic examples above are editorial guidance, not performance claims.