
Read Nginx visitor analytics without confusing requests, sessions and people
Interpret visitor paths, sources and interaction timelines with clear collection boundaries, honest session counts and explicitly illustrative visual examples.

A request count, a visitor row and an interaction timeline answer different questions. A browser can make several requests while loading one page, and a session grouping is not proof that the records belong to one unique person. Browser-side events also depend on collection that may be absent from otherwise valid server logs. These distinctions matter when investigating traffic from a desktop server workspace. This guide explains how to use the visitor views around All in Term's Nginx tools while preserving the boundaries of the evidence. All charts and numeric examples are synthetic and describe a fictional site, not measured product or customer results.
Write the question before choosing the metric
Start with the operation you want to understand. A landing page may receive many requests while few recorded sessions reach a later route. A service may experience a traffic spike that comes mostly from assets or automated clients. These are different questions. Identify the hostname, relevant paths and observation period before choosing a graph. A large total is useful only when its population and window are known.
In All in Term, keep the selected server and domain context visible while inspecting traffic. Record the timezone used for the comparison and note which files or collection modes provide the data. A CDN, load balancer or another proxy can observe a different population from the origin server. Comparing their totals without aligning the sources can turn a normal architecture difference into an apparent analytics bug.
Ask what was recorded before asking what it means.
- 01
Scope
Choose domain and time window.
- 02
Collection
Identify request and event sources.
- 03
Inspect
Read paths and supported context.
- 04
Interpret
Keep inferences and gaps explicit.
Conceptual workflow · follow each check before moving to the next step.
Separate access records from browser interaction events
Nginx access records describe requests under the configured log format. They do not automatically provide every browser interaction that happened between those requests. Richer behavior views require the relevant tracking to be configured and actually delivered to the page. Confirm the collection mode before interpreting a missing interaction. A functioning website can produce server requests even when no browser interaction timeline is available.
All in Term provides explicit setup actions for richer collection rather than treating every field as universally present. These actions can change the server configuration, so review them deliberately. Inspect the fields, access and retention appropriate to the site before enabling collection. Do not describe the resulting system as anonymous merely because the main view uses a session identifier. Identifiers, page paths and ordinary event content can still reveal meaningful information about activity.
| Evidence | Supports | Does not automatically prove |
|---|---|---|
| Access record | A request reached the logged server | One unique person viewed a page |
| Session row | Activity grouped by the available model | A complete personal identity |
| Interaction timeline | Captured events in their observed sequence | Complete screen video or every action |
| User-agent category | A claimed or inferred client class | Verified crawler ownership |
Traffic records and interaction events are different evidence.
The two streams distinguish server request records from browser-side interaction events. Either can be incomplete, and they should not be treated as interchangeable.
Request context
Access records describe what reached the logged server under its configured format.
Interaction context
Richer timelines require the relevant collection to be enabled and actually present in the browser path.
Read a session grouping as an operational model
A visitor row helps organize observations, but its label should not become a stronger identity claim than the data supports. Shared network addresses, changing addresses, multiple browsers and incomplete collection can all complicate grouping. Use the view to inspect recorded activity around a question, not to make unsupported claims about a specific person's complete history. The useful next step is often a route or event inspection rather than an identity conclusion.
When comparing groups, keep the grouping rule and the sampled window consistent. The first chart shows an invented distribution of recorded sessions by entry route. It illustrates how a prominent landing route may dominate the available dataset, but it does not establish the number of unique people who visited the fictional site. Exact values are printed beside each bar so the graphic remains interpretable without relying on color or visual estimation.

The observation point changes the population.
A CDN, an origin access log and a browser event stream can record different parts of the same site activity.
Concept illustration, not an application screenshot.Follow a route sequence and preserve its gaps
Inspect the selected session's available page sequence around the point of interest. A page path, source and event time can help explain a transition. A gap between two observations remains a gap; the viewer should not invent a click or navigation that was never recorded. Replay-style inspection is a representation of captured activity, not a guarantee of complete screen video or every browser event.
If the observed path ends early, compare other evidence before declaring that the user abandoned the page. Collection can stop, navigation can move outside the tracked scope, or the relevant event may not be supported. Keep the language proportional to what is available: the last recorded page is a supported observation, while the visitor's intention may remain unknown. The visual journey below uses gaps to emphasize that distinction.
Entry routes in 200 fictional recorded sessions
Unit: recorded sessions in example. Synthetic example values, not production measurements.
Bars start at zero and share the same linear scale. Exact values are printed alongside each bar.
Use device, source and bot labels carefully
Browser and device fields depend on the information available in the request or tracked event. A recognizable user-agent string is useful for grouping, but a requester can choose the string it sends. Treat bot categories as claimed or inferred classifications unless an appropriate verification process has established more. Similarly, a missing referrer does not prove a visitor typed the address manually; browsers and navigation policies can limit what is shared.
Use these fields to narrow an operational question rather than to assign certainty. For example, compare the routes and response outcomes associated with one claimed crawler category before considering any policy change. If provider identity matters, consult its current official verification guidance. The second chart groups fictional recorded sources and leaves unknown entries visible. Unknown data is an honest category, not a display defect that must be filled with a guess.
Connect an observation with a measurable product question
Suppose a form page appears frequently in recorded sessions but the following confirmation route appears rarely. Treat that as a reason to inspect the flow. Test the form with an authorized example, check application errors and compare the collection scope. Do not assume that a missing confirmation event proves a failed submission. The correct business outcome may be recorded elsewhere, and some successful operations may not navigate to the route you expected.
If you want a conversion analysis, define its eligible population and success event before calculating a percentage. The current visitor tools support inspection of available paths and interactions; they are not a promise of a fully configured business attribution system. Keep experimental observations separate from verified service outcomes. A clear question makes it easier to choose whether the next improvement belongs in the site, collection setup or application behavior.

Read a visitor path as a sequence with limits.
The page sequence illustrates a path reconstructed from available events. Gaps remain gaps; a visual timeline should not invent activity that was not recorded.
Inspect transitions
Look at the route, source and event time around the step that matters.
Avoid false certainty
A session label is an operational grouping and is not proof of a unique person's identity.
Keep the report useful after the live view changes
Summarize the domain, time window, collection mode, relevant routes and important missing fields. Include a few representative observations rather than a broad export of every event. Record what was inferred and what was directly observed. This gives another operator enough context to assess the conclusion even after the live dataset or retained records have changed.
Review collection and retention as part of normal site operation, especially when new pages or form fields are introduced. All in Term brings request analytics and visitor inspection close to the Nginx configuration and the connected server. Use that context to understand where the evidence came from. Good visitor analysis does not depend on making every chart look complete; it depends on explaining the records that exist and the questions they can actually answer.
Inside the application: a scoped local example
This capture uses the shipped UI component in an isolated renderer. The host, files and service data are demonstrations, not a production session. It illustrates the surrounding workflow; it does not verify every service-specific command in this guide.
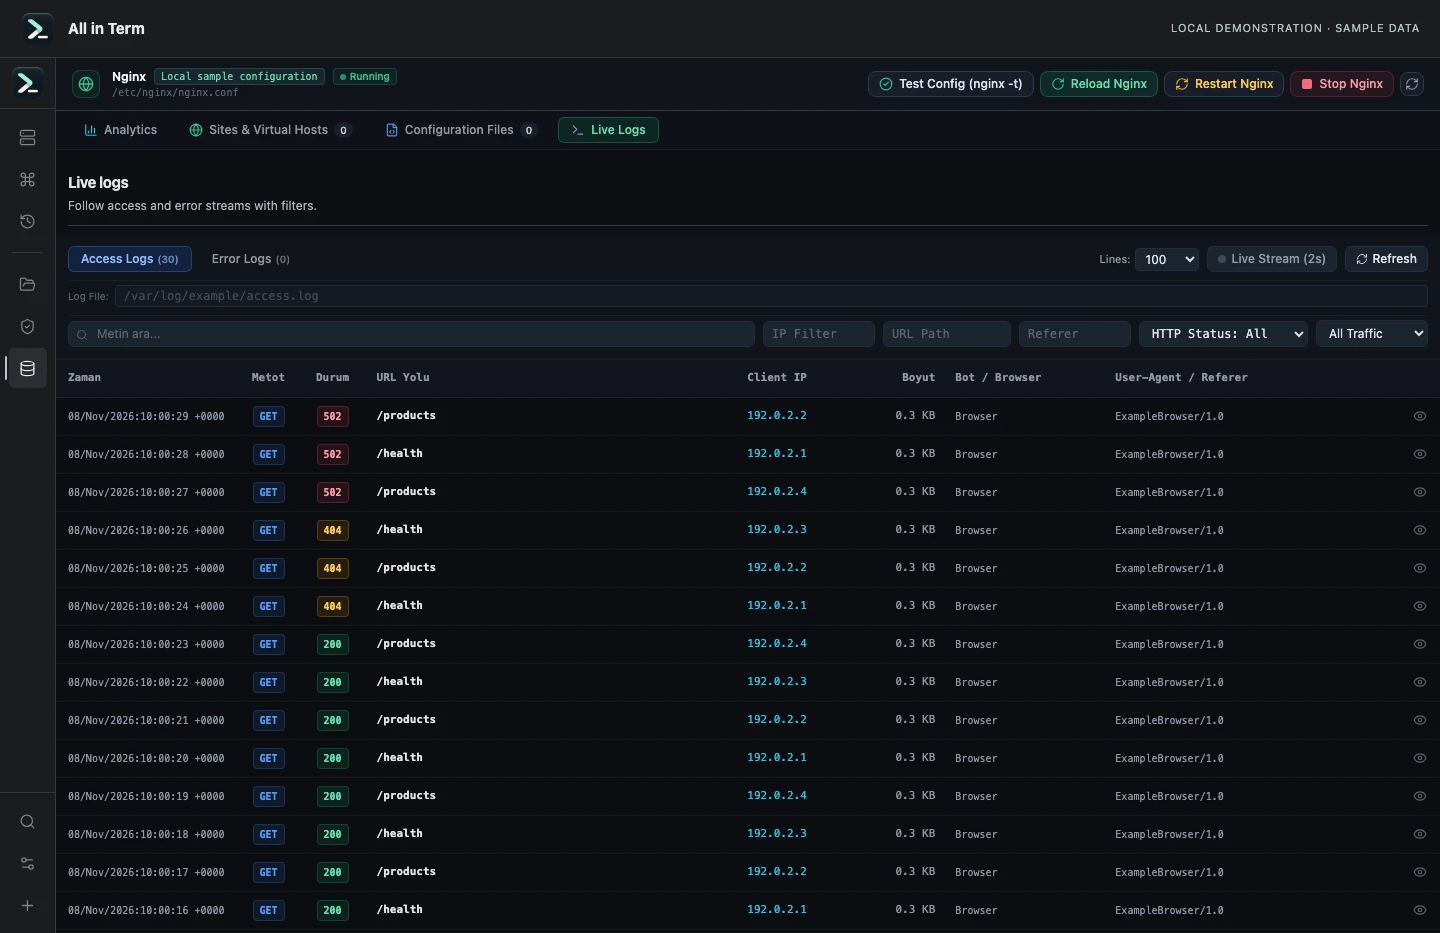
Nginx component displaying results parsed from 30 synthetic request records; no live Nginx server was inspected. Captured 2026-11-08. Open the image to inspect details.
Parse a known access-log fixture
Executed the current Nginx log parser against 30 synthetic access records and one synthetic error record. These counts describe only that fixture.
Executed check
parseRawNginxLogs(accessFixture, "access", examplePath)Recorded output
Parsed access records: 30
200 responses: 24
404 responses: 3
502 responses: 3
Parsed error records: 1
Recorded 2026-11-08. Executed locally against synthetic fixtures. No production host or database was contacted. Read the recorded checks.
Sources in the same fictional session sample
Unit: recorded sessions in example. Synthetic example values, not production measurements.
Bars start at zero and share the same linear scale. Exact values are printed alongside each bar.
A small command example
Read the comments, confirm the active host and adapt any example names to your environment before running commands.
# Validate intended Nginx configuration changes before activation
# This does not by itself verify browser-side collection
nginx -t
Further reading
Official documentation for the underlying tools. The workflows and synthetic examples above are editorial guidance, not performance claims.