Read PostgreSQL EXPLAIN ANALYZE and find slow query steps
Learn to read PostgreSQL EXPLAIN ANALYZE output. Compare estimated and actual rows, account for loops, and interpret buffer hits and reads.
A PostgreSQL query can feel slow for several reasons, including the work done by the server and the time spent transferring or displaying results. A query plan helps you focus on the server portion. This guide uses a read-only example against a disposable fixture, compares estimated rows with observed rows and explains how loops and buffers change the interpretation. Start with the exact query shape and parameter values that matter to your investigation.
Get the estimate before running the statement
Start with plain EXPLAIN on the statement you intend to investigate. It displays the chosen plan without executing the query itself. Read the plan from its inputs through the parent nodes. Scan nodes identify how PostgreSQL accesses rows, while joins, sorts and aggregates combine or transform them. Ask which nodes are needed for the result and how many rows the planner thinks each one will return.
The cost numbers are in planner units. Keep them separate from wall-clock milliseconds shown by an executed plan. A sequential scan can be reasonable for a small table or a query that needs much of it. An index can help when the filter selects a small subset and the access pattern fits the index. Choose a specific question, such as whether the planner expects a predicate to be far more selective than the real data suggests, before deciding what to change.
From the first check to verification
- 01
Estimate
Read the plan with plain EXPLAIN.
- 02
Observe
Execute a controlled SELECT with ANALYZE.
- 03
Compare
Review rows, loops and buffers.
- 04
Retest
Validate output and repeat under similar conditions.
Conceptual workflow · follow each check before moving to the next step.
Use ANALYZE in a controlled environment
EXPLAIN ANALYZE executes the statement and adds observations to the plan. Keep the example to a SELECT against test data. Even a read-only query can consume CPU, memory and I/O, so use an approved environment and sensible time bounds for expensive statements. For a write statement, execution can change data. Use plain EXPLAIN if you only need an estimate. Keep the example fixture separate from operational tables so the test cannot accidentally target a real dataset.
Use the same parameters, schema and relevant planner settings when comparing alternatives. A query that retrieves one customer's recent orders may produce a different plan for a customer that accounts for a large fraction of the table. Record your parameters and the dataset shape with the plan. A synthetic fixture is useful for learning how to read the output. For a real performance decision, evaluate a representative distribution and the conditions that reproduce the original problem.
| Item | What it tells you | Example or next step |
|---|---|---|
| Estimated rows | Planner expectation per execution | Compare with observed rows |
| Actual rows and loops | Average output and execution count | Consider the work across all loops |
| Shared hit / read | Shared-buffer access | Distinguish a hit from a block brought into buffers |
| Execution time | Server-side execution measurement | Compare with end-to-end app latency separately |
Connect each plan node to the work it performs.
Start with the table access and trace how rows move through the operators that produce the result.
Estimate
Read the plan with plain EXPLAIN.
Observe
Execute a controlled SELECT with ANALYZE.
Compare estimated and actual rows
Read the row estimate for a node beside the observed row count. Pay attention to its loop count. For repeatedly executed nodes, reported actual rows and timing are averages per execution. An inner scan that produces only a few rows each time can still do considerable total work if a nested loop invokes it many times. Multiply average rows by loops for an approximate count of rows produced across executions, and allow for display rounding.
Trace a large difference back toward the earliest node where the estimate diverges. A mistaken estimate at one input can influence a later join decision. Compare the relevant filter and the available statistics. A skewed value distribution or a relationship between columns can make a simple estimate less representative. Treat any proposed index or statistics change as a hypothesis, then compare plans and behavior after an approved change to see whether the expected effect occurred.
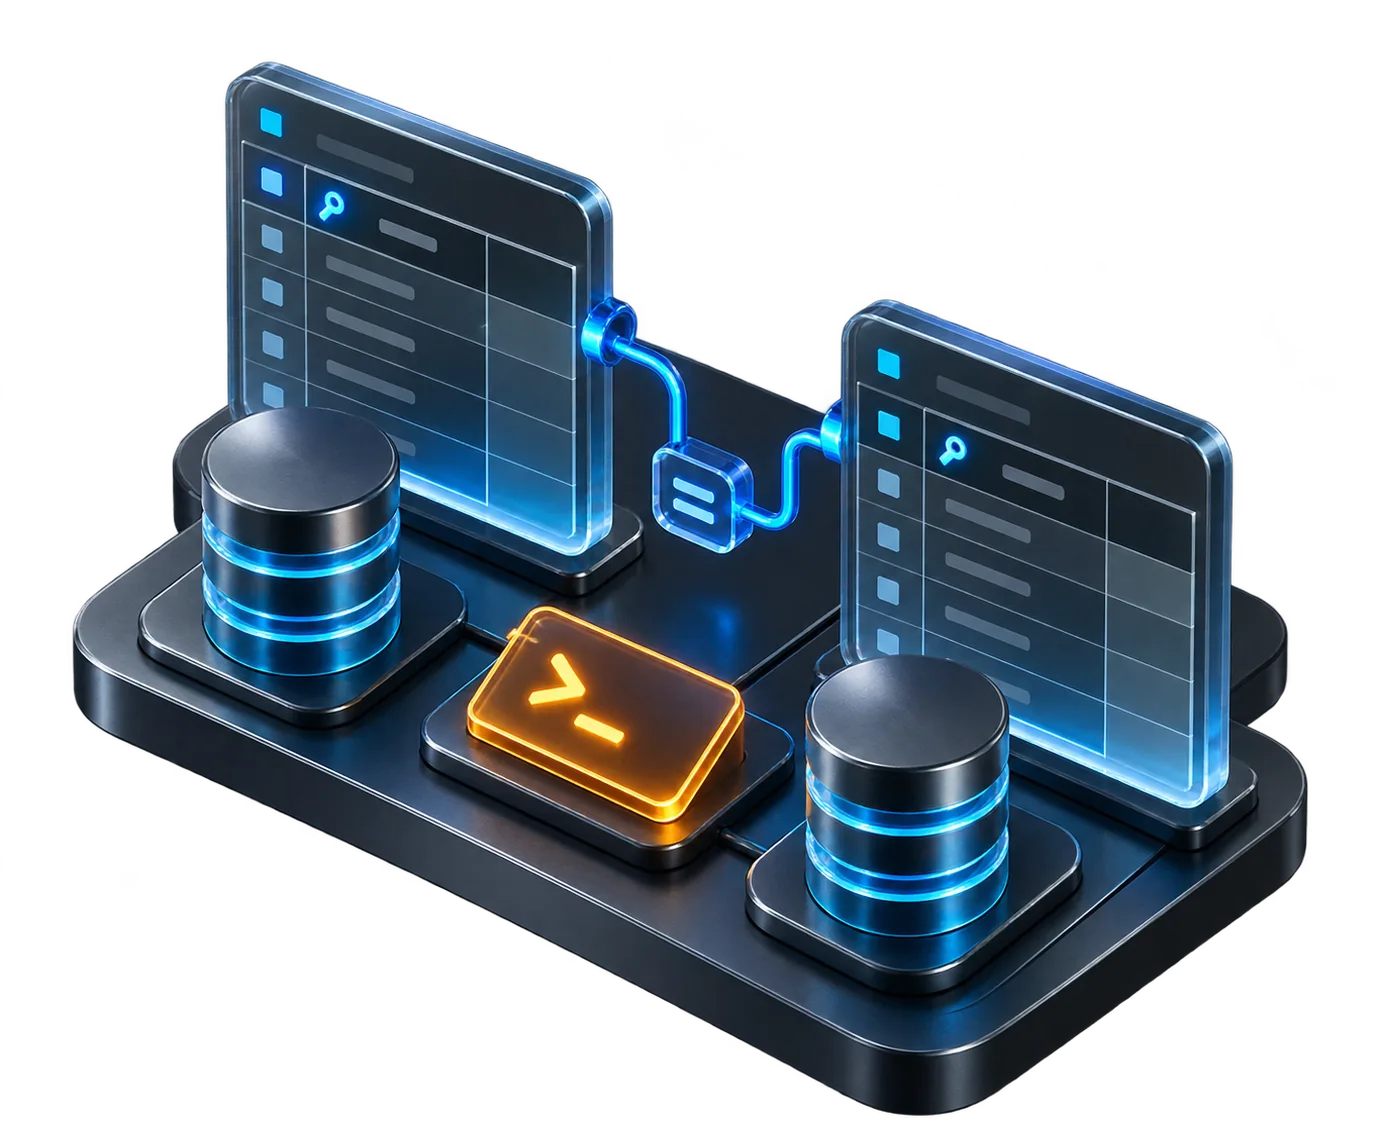
Distinguish database work from client display.
A query plan describes database operators. Measure result transfer and rendering separately.
Concept illustration, not an application screenshot.Read timing and buffers in context
Look at the startup and total actual times for nodes and consider how they compose. Parent nodes include work from their children, so adding the times printed on every line can count the same work more than once. Review execution time for the statement and keep it separate from planning time and from the application latency that includes network transfer, response serialization and client-side rendering. An EXPLAIN result answers a narrower question than a full request trace.
Buffer output describes work involving shared, local or temporary blocks. Shared hits indicate blocks found in PostgreSQL's shared buffers. A read into those buffers can still be served by the operating system cache. Compare the buffer patterns alongside rows, loops and observed timing. When a second run reads fewer blocks or finishes faster, consider cache effects before attributing the change to your query rewrite. Record whether the comparison was made under similar conditions.
The chart illustrates a node returning more rows than the planner expected. Check that the estimate and observed count refer to the same node before comparing them. If the node has many loops, use the reported average for the estimate comparison and consider the total separately.
Example of a row-estimation mismatch
Unit: rows per execution. Synthetic example values, not production measurements.
Bars start at zero and share the same linear scale. Exact values are printed alongside each bar.
Change the query with a clear prediction
Suppose your application needs a page of recent open orders for one account. First confirm the filter, sort order and limit that define that page. If the plan reads a large set and sorts it before returning a few rows, explore whether a suitable index can support that access pattern. Predict what should change in the plan, then review the candidate on representative test data. Check write overhead and storage implications before proposing a persistent index.
Compare output as well as speed. A change that returns fewer rows can look faster because it no longer answers the same question. Verify sorting and tie-breaking, especially if the result is paginated. In All in Term, use the PostgreSQL workspace to inspect the schema and a bounded query result alongside your server session. Run plan experiments through an approved SQL client or psql session. Keep the plan, query parameters and the observed application result together so each measurement has a clear scope.
Keep a record someone else can rerun
Save the query, the environment, the parameter values and the two plans if you tested a change. Mark which node you investigated and why. Include actual rows and loops and any relevant buffer counts. Write down how you verified the same output and which part of the application improved. This record is easier to review than a single latency number without a query or a test environment attached.
If the query plan looks reasonable but the page is still slow, measure the next segment of the request. A wide result can take time to transfer, and a client can spend time displaying a large document. Check result size and response handling separately from database execution. Then repeat the original request under comparable conditions. That sequence gives you a way to decide whether further database work is justified or whether the evidence points to a different part of the application.

Read rows, loops and buffers together.
A small row count can represent substantial work when a node runs many times. Check the loop count and surrounding nodes.
Compare
Review rows, loops and buffers.
Retest
Validate output and repeat under similar conditions.
Inside the application: a scoped local example
This capture uses the shipped UI component in an isolated renderer. The host, files and service data are demonstrations, not a production session. It illustrates the surrounding workflow; it does not verify every service-specific command in this guide.
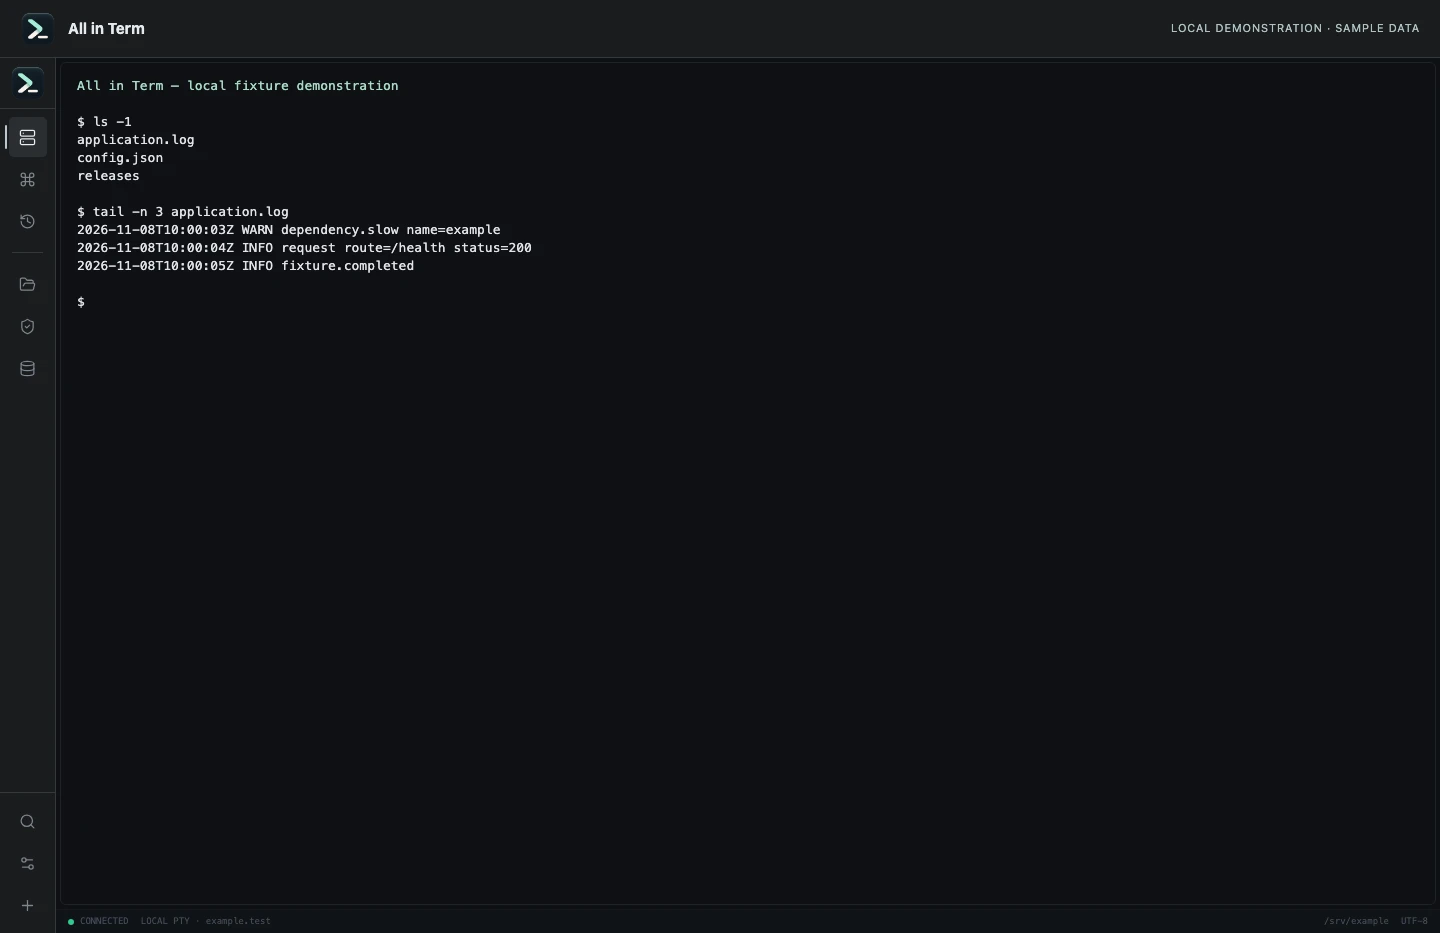
Local terminal view with command output recorded from an isolated temporary directory. Captured 2026-11-08. Open the image to inspect details.
List an isolated example directory
Executed /bin/ls against a newly created temporary directory.
Executed check
ls -1Recorded output
application.log
config.json
releases
Recorded 2026-11-08. Executed locally against synthetic fixtures. No production host or database was contacted. Read the recorded checks.
A small command example
Read the comments, confirm the active host and adapt any example names to your environment before running commands.
-- Use a disposable database. This fixture lives inside a transaction.
BEGIN;
SET LOCAL statement_timeout = '5s';
CREATE TEMP TABLE explain_demo (id integer, status text);
INSERT INTO explain_demo
SELECT n, CASE WHEN n % 10 = 0 THEN 'open' ELSE 'closed' END
FROM generate_series(1, 1000) AS series(n);
ANALYZE explain_demo;

EXPLAIN SELECT id FROM explain_demo WHERE status = 'open';
EXPLAIN (ANALYZE, BUFFERS)
SELECT id FROM explain_demo WHERE status = 'open';
ROLLBACK;
Further reading
Official documentation for the underlying tools. The workflows and synthetic examples above are editorial guidance, not performance claims.