Fix Nginx 504 Gateway Timeout by Tracing Upstream Latency
Diagnose an Nginx 504 Gateway Timeout with upstream logs and curl timings. Compare connection delays, slow response headers and read timeouts.

A 504 tells you a gateway did not receive a timely response from the next service. Identify the layer that emitted it, then determine which part of the upstream exchange ran out of time. This walkthrough uses a read-only reproduction and example timings to distinguish connection problems, delayed response headers and slow dependencies. Keep the original route and timestamp for a comparable retest.
Find the layer that returned the timeout
A browser may receive a 504 from a CDN, load balancer or Nginx instance. Find the matching request in the relevant access logs before editing a timeout directive. Record host, path and timestamp and use a request identifier when available. If no match appears, check log routing, timezones and the layer immediately upstream. Measure one safe request from the affected client perspective and capture its status and total time.
A useful record distinguishes the time when the client sent its request from the time the gateway returned the status. If the access log is written when the request completes, looking at the same second in the application log can miss a long-running operation. Search a bounded window that covers the entire request. Prefer a shared request identifier when available. If you add timing fields to a log format, keep the changes appropriate to the environment and verify a sample entry before depending on it.
Choose a check for the task
- 01
Connection phase
Check routing and listening address
- 02
Before headers
Check workers and dependencies
- 03
During body
Check streaming behavior and read gaps
Conceptual workflow · follow each check before moving to the next step.
Read which upstream phase stalled
Match the request with the Nginx error log and read the phase described there. A connection that stalls points toward routing, an address or a busy listener. A delay before response headers directs attention to application work, queues and dependencies. A timeout while reading a response body can mean that the upstream stopped sending data for too long. Keep the observed phase in your incident note so you do not conflate all timeouts with slow application code.
With multiple upstreams, compare requests routed to each backend. A single saturated worker can produce intermittent timeouts while requests to other workers look healthy. Preserve the target address and timing in the evidence you share. When a request is retried upstream, the record may include several attempts. Review the retry policy and which operation was requested before drawing conclusions from a total time. A single user-visible response can represent more than one backend exchange.
| Option or symptom | What to look for | Where to start |
|---|---|---|
| Connection phase | Upstream connection stalls | Check routing and listening address |
| Before headers | Connection opens, response is delayed | Check workers and dependencies |
| During body | Upstream stops sending data | Check streaming behavior and read gaps |
Reverse proxy request paths
Find the gateway that emitted the timeout and match its request record.
Workflow
Check routing and listening address
Reproduce from the proxy's network context
If the upstream speaks HTTP, test an approved endpoint from the place where the proxy runs. Match the scheme, hostname, route and host header needed for that test. A successful local test on your laptop is weaker evidence than a request made from the proxy's container or host namespace. Record connect time, time to first byte and total time. In curl, first-byte time is cumulative from the start of the request, so avoid treating it as an additional segment to add to connect time.
Try to reproduce the issue with a safe request that retains the expensive part of the original route. Replacing a report request with a health probe is useful for establishing a baseline, but the health route may never check the database query or external dependency that makes the report slow. If the real action changes data, reproduce it using a staging fixture or use an existing trace. Avoid replaying a live write simply to collect timing information.

Reverse proxy request paths
Find the gateway that emitted the timeout and match its request record.
Concept illustration, not an application screenshot.Compare example timings across requests
The chart compares fictional total times for a public health check, a direct upstream health check and the affected upstream route. In this example the affected route takes far longer than either health check. Follow that route into application logs or traces and look for blocked workers, long database queries or slow external calls. Do not infer that all requests are healthy from one quick health endpoint. Reproduce under comparable traffic when that is part of the condition.
In this example, the affected upstream route takes 4,100 milliseconds and the upstream health check takes 52 milliseconds. The roughly 79-fold difference compares two different routes in the same example. It gives you a reason to inspect the report path and its dependencies before changing a shared proxy setting.
Example response times by route and vantage point
Unit: milliseconds. Synthetic example values, not production measurements.
Bars start at zero and share the same linear scale. Exact values are printed alongside each bar.

Upstream response timing
Distinguish connection time from the time until the first response byte.
Workflow
Check workers and dependencies
Review timeout settings after you have evidence
Nginx documents separate proxy connection and read timeout settings. Its upstream read timeout applies between successive read operations. An edge may have its own independent deadline. A longer timeout can be reasonable for a reviewed workload with suitable resource limits, but also lets work occupy capacity longer. Confirm which layer and phase need a change and document how you will reverse it. Validate the configuration before reloading and compare behavior under the same request shape.
A repair can live in application work, capacity management or proxy configuration. For example, an expensive report may need a query change validated with realistic data, while a rare network timeout needs an investigation of the path. Record the intended effect of your proposed change before applying it. Compare the same route with the same request shape afterward and keep the status, response time and evidence from the dependency together. A shorter duration is meaningful only if the request still returns the expected result.
Retest the route that users reported
Consider a report endpoint with a normally quick health check and a request that takes several seconds before the first byte arrives. Run the comparable staging request twice and check whether an upstream connection is established promptly both times. If it is, correlate the delay with the application request identifier. One trace might show a worker waiting for a database connection, while another shows time spent in a specific query. Those observations point to different remedies. When you try a fix, check the report body as well as the latency. A fast failure response could bring down the timing number while leaving the user unable to obtain the report. Preserve the previous baseline and include the conditions that made the symptom reproducible.
Confirm that the original route returns the expected content, record the time and inspect fresh errors. Check a nearby route to catch side effects from edits to a shared location. All in Term gives a Mac operator SSH, remote files and a way to inspect readable remote logs in the same workspace. Download it for a staging trial if you frequently move between those checks. Keep a short record that says which phase stalled and what observation confirmed recovery.
Application and database dependency
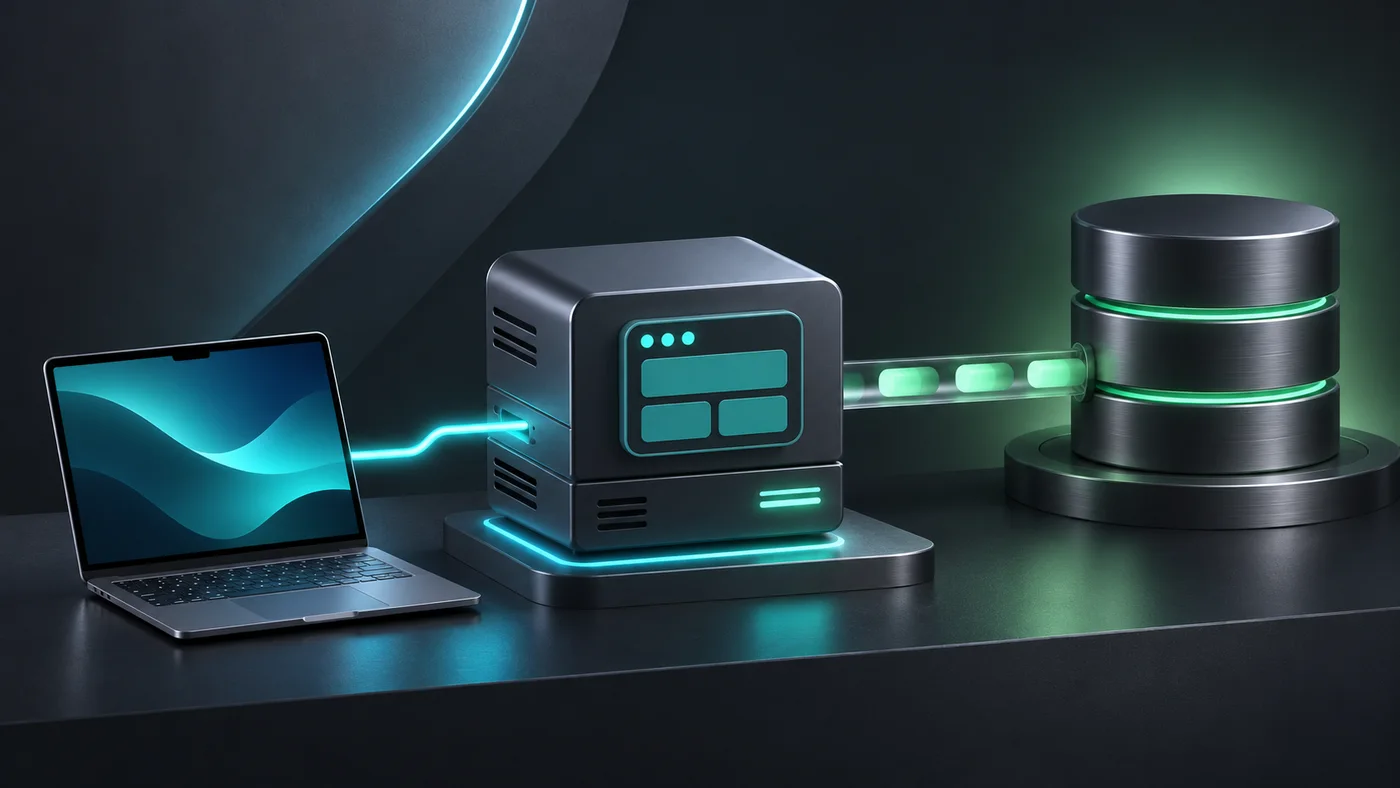
Correlate a slow route with work in the application and downstream services.
Workflow
Check streaming behavior and read gaps
Inside the application: a scoped local example
This capture uses the shipped UI component in an isolated renderer. The host, files and service data are demonstrations, not a production session. It illustrates the surrounding workflow; it does not verify every service-specific command in this guide.
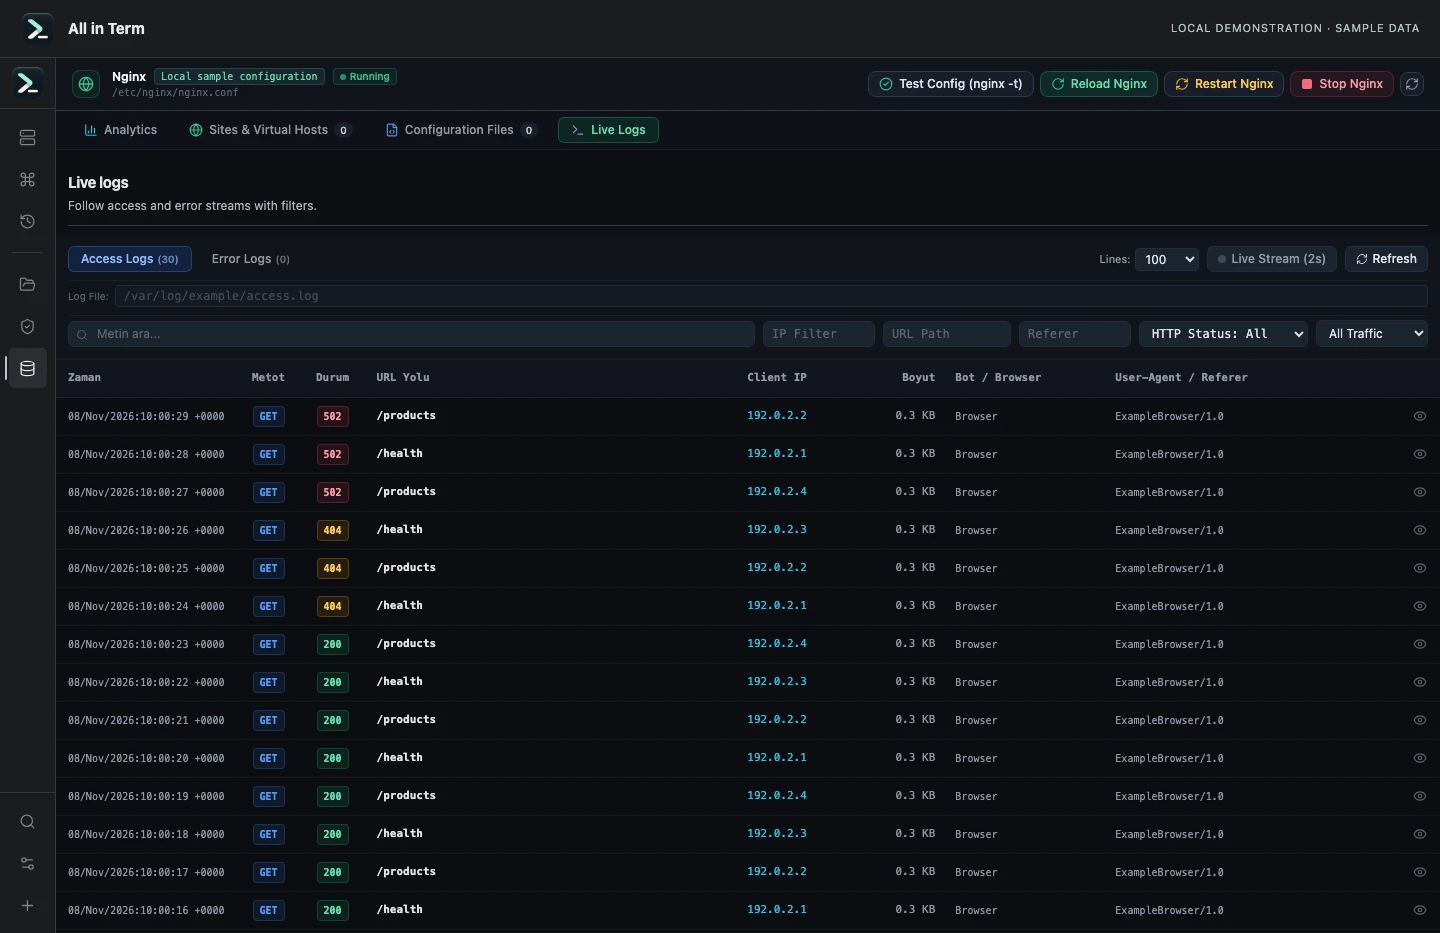
Nginx component displaying results parsed from 30 synthetic request records; no live Nginx server was inspected. Captured 2026-11-08. Open the image to inspect details.
Parse a known access-log fixture
Executed the current Nginx log parser against 30 synthetic access records and one synthetic error record. These counts describe only that fixture.
Executed check
parseRawNginxLogs(accessFixture, "access", examplePath)Recorded output
Parsed access records: 30
200 responses: 24
404 responses: 3
502 responses: 3
Parsed error records: 1
Recorded 2026-11-08. Executed locally against synthetic fixtures. No production host or database was contacted. Read the recorded checks.
A small command example
Read the comments, confirm the active host and adapt any example names to your environment before running commands.
curl -sS -o /dev/null --connect-timeout 3 --max-time 10 -w 'status=%{http_code} connect=%{time_connect} first_byte=%{time_starttransfer} total=%{time_total}\n' https://shop.example.com/reportFurther reading
Official documentation for the underlying tools. The workflows and synthetic examples above are editorial guidance, not performance claims.