
Fix Nginx 502 Bad Gateway by checking the upstream
Diagnose Nginx 502 Bad Gateway by matching access and error logs, testing the upstream from the proxy network, and verifying the affected route.

A page that suddenly returns 502 Bad Gateway gives you a place to start. A gateway somewhere in the request path could not complete its exchange with the next service. The status alone does not tell you whether that service stopped listening, the proxy target changed, or a response failed during transit. This guide follows one failing request from the edge to the configured upstream, using checks you can repeat after a repair.
Pin down the request that fails
Write down the public hostname, the path, the approximate start time and whether the error affects every request. Reproduce it with a safe request that does not change application state. Capture the status, timestamp and any request identifier your application already exposes. A login page, an asset and a health endpoint may use different locations, so a successful request to one path does not clear the others. Use the route that actually demonstrates the problem.
If you have an edge service or load balancer, identify which layer emitted the 502. Look for a matching request in the Nginx access log if you have access to it. A lack of records can indicate the request stopped earlier, although log selection and retention can also explain a gap. Compare the timestamp and timezone across layers. Even a short offset can send you toward an unrelated deployment or a different customer's request during a busy period.
From the first check to verification
- 01
Reproduce
Record the route, status and time.
- 02
Locate
Find the proxy error and its target.
- 03
Test
Check the upstream from the proxy context.
- 04
Verify
Repeat the original public request.
Conceptual workflow · follow each check before moving to the next step.
Read the error and the target together
Find the corresponding error log entry and copy the relevant part into your investigation notes. Look for the destination address or socket and the phase of the exchange in which the failure occurred. A refused connection makes the listener and address good first checks. A permission error on a Unix socket makes the proxy worker's access and the directory permissions relevant. A connection that closes before a valid response calls for the application logs in the same time window.
Treat each message as evidence that narrows the search. A stopped process and an incorrect port can both produce a refused connection. An application may close a connection while crashing, enforcing a policy or speaking a different protocol than the proxy expected. Make a short list of plausible causes and choose the observation that separates them. If you can, retain the exact message before restarting anything. A restart can remove the failed state you need to inspect.
| Item | What it tells you | Example or next step |
|---|---|---|
| Connection refused | Target address and port | Check the listener and process state |
| Socket permission denied | Socket path and worker identity | Review socket and directory access |
| Upstream closed early | Application logs at request time | Look for exits or protocol mismatch |
| One backend fails | Backend identity for each error | Compare instances |
Trace the request through the gateway.
The public route and the upstream endpoint are separate observation points.
Reproduce
Record the route, status and time.
Locate
Find the proxy error and its target.
Test from the proxy's network context
Identify the active virtual host and location that match the failed request. Read the configured upstream and distinguish the hostname, port, protocol and any rewritten path. A local service at 127.0.0.1 belongs to the network namespace of the process using that address. If Nginx is in a container, a test from the host shell can reach a different listener and tell you very little about what the proxy can reach.
For an HTTP upstream, send a small request from the proxy's network context to a known safe endpoint. Check whether the listener accepts the connection and whether it responds using the expected protocol. Where the application routes by host or path, reproduce those inputs too. A Unix socket or a FastCGI upstream requires a protocol-appropriate check. Sending plain HTTP to a FastCGI endpoint would create a new error without telling you whether the original configuration is healthy.
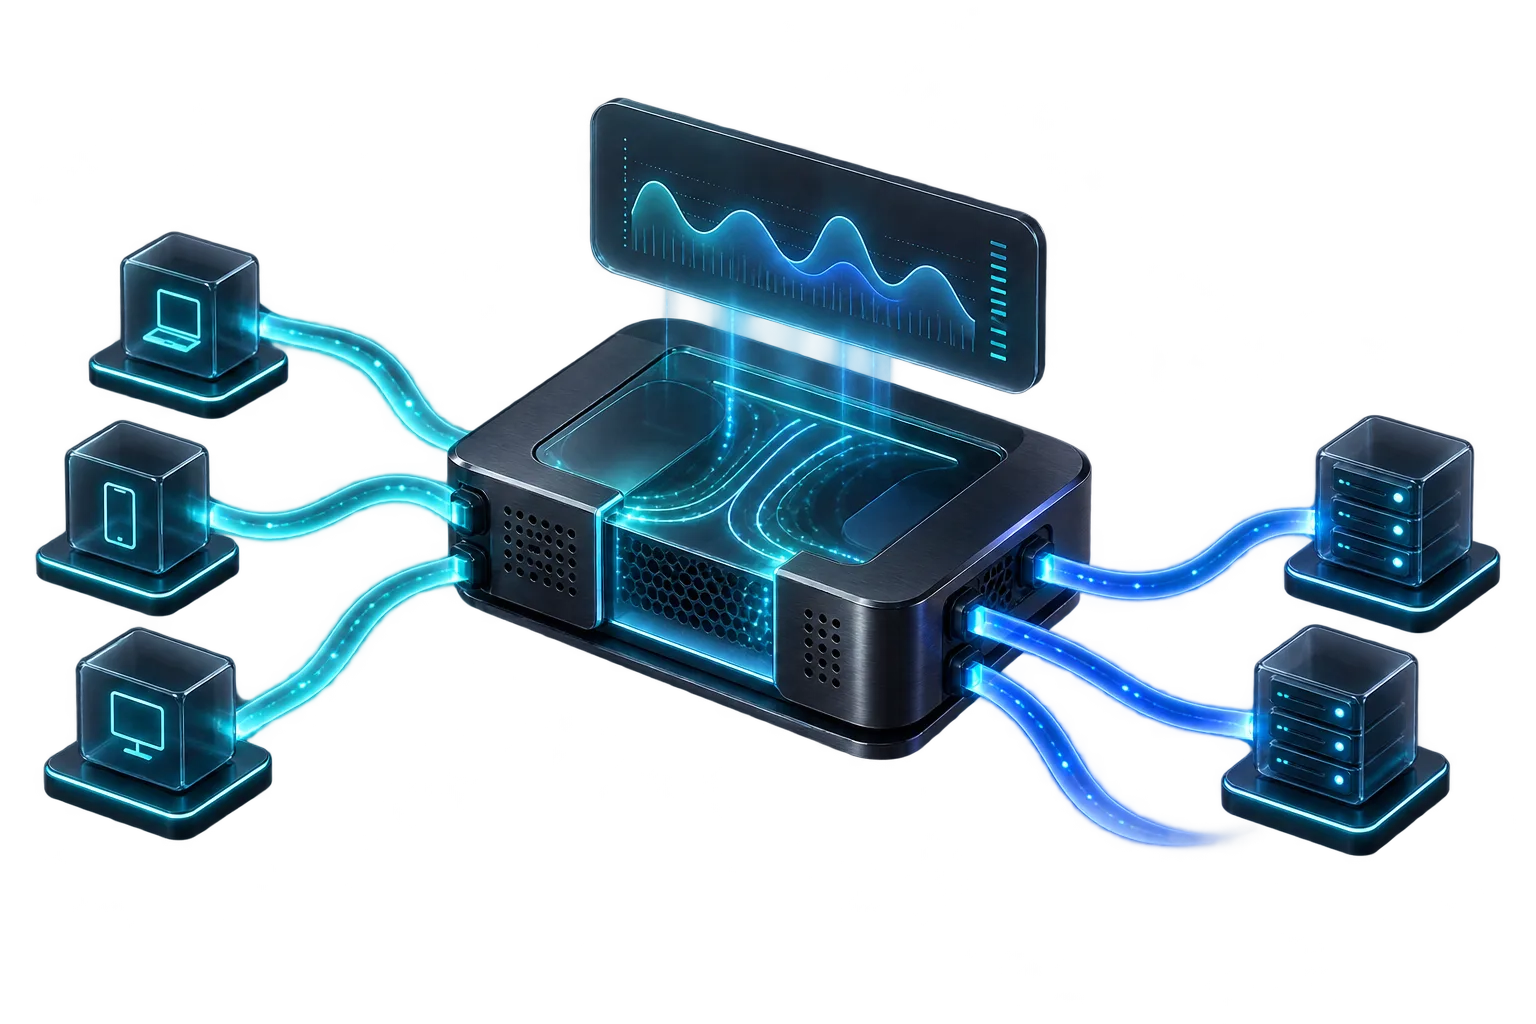
Correlate the original request with the proxy error.
Use the request path and time to find the corresponding entry before testing the upstream.
Concept illustration, not an application screenshot.Follow the result to the next owner
If the connection is refused, compare the target with the application's actual listening address and check whether it recently exited. If the hostname no longer resolves where the proxy runs, review the service name, network membership and relevant resolver configuration. If the connection succeeds but the response stops early, correlate the application log with the request time and look for process exits, crashes or resource pressure. If the error concerns TLS, verify the scheme and expected peer name before changing certificate settings.
A working health endpoint is a useful observation, but the original route may depend on a database, authentication service or a different worker. Repeat an appropriate safe request that exercises the affected route when possible. If requests fail intermittently, record several examples and see whether they point to the same backend. This can reveal a single unhealthy instance behind a pool even while requests routed to other instances continue to work normally.
In the fictional chart, most recorded failures point to backend B. Check how much traffic each backend handled before comparing failure rates. Error counts alone cannot tell you whether one backend handled more requests. Use the concentration to prioritize inspection, then look for the matching application evidence.
Sample errors grouped by upstream instance
Unit: 502 responses. Synthetic example values, not production measurements.
Bars start at zero and share the same linear scale. Exact values are printed alongside each bar.
Change one thing and preserve a rollback path
Once you have evidence of a mismatch, make the smallest relevant repair through your normal deployment process. For example, update a stale proxy target to the reviewed service address or restore the application listener expected by the existing configuration. If editing Nginx configuration, validate it in the deployment environment before reloading it. Syntax validation alone does not prove the upstream is reachable. Keep a record of the prior value and use your team's rollback procedure if the verification fails.
In All in Term, an SSH session can sit beside remote files and the log views used for the investigation. Use the file comparison to review the intended configuration edit and use remote log follow for a readable log file when access allows. Treat the views as observations of the same host and time window. The useful result is a documented explanation for the failure and evidence of recovery on the affected route.
Verify the original symptom
Repeat the same safe request against the public hostname and compare the result with your baseline. Check that expected status and response content returned, and then look at fresh error entries. Test a nearby route that should still work, especially if the repair touched a shared proxy location. A single successful request can be a start, while repeated checks over an appropriate observation window give more confidence when failures were intermittent.
Write down which layer produced the error, what was wrong with its upstream exchange, and which observation confirmed the repair. Include the timeframe and the version or configuration change if those details are available. This note makes the next incident easier to recognize. It also prevents a generic instruction to restart the service from becoming the team's default response when a different upstream failure produces the same visible status code.
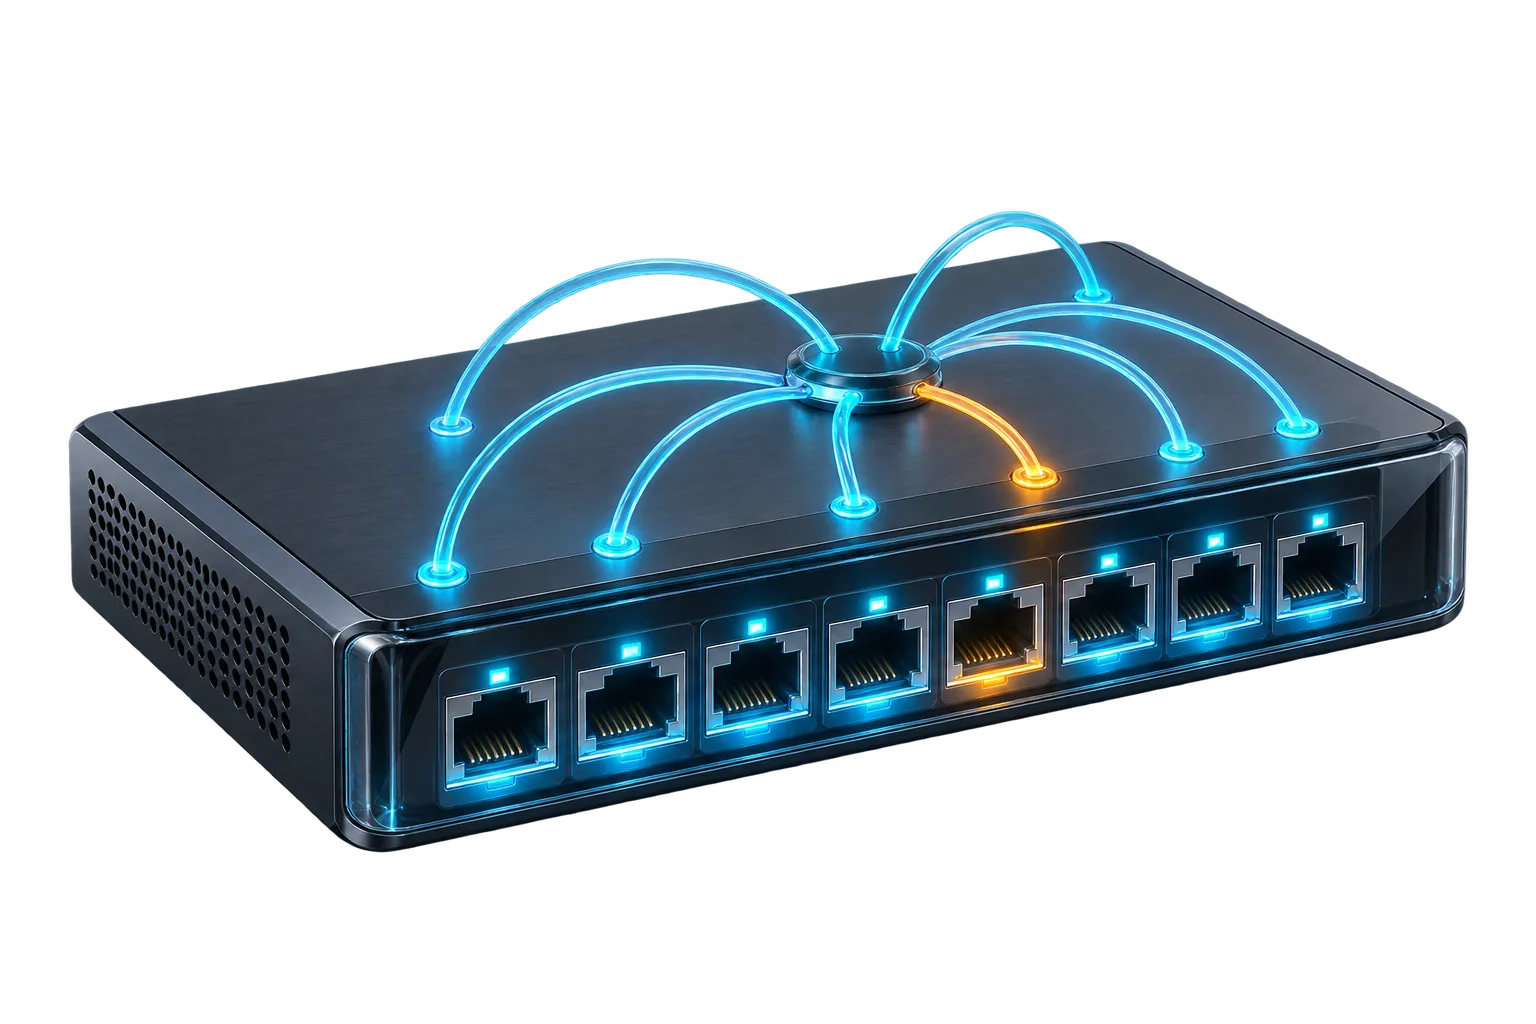
Find the listener the proxy actually uses.
Compare the configured address and port with the listener in the proxy’s network context.
Test
Check the upstream from the proxy context.
Verify
Repeat the original public request.
Inside the application: a scoped local example
This capture uses the shipped UI component in an isolated renderer. The host, files and service data are demonstrations, not a production session. It illustrates the surrounding workflow; it does not verify every service-specific command in this guide.
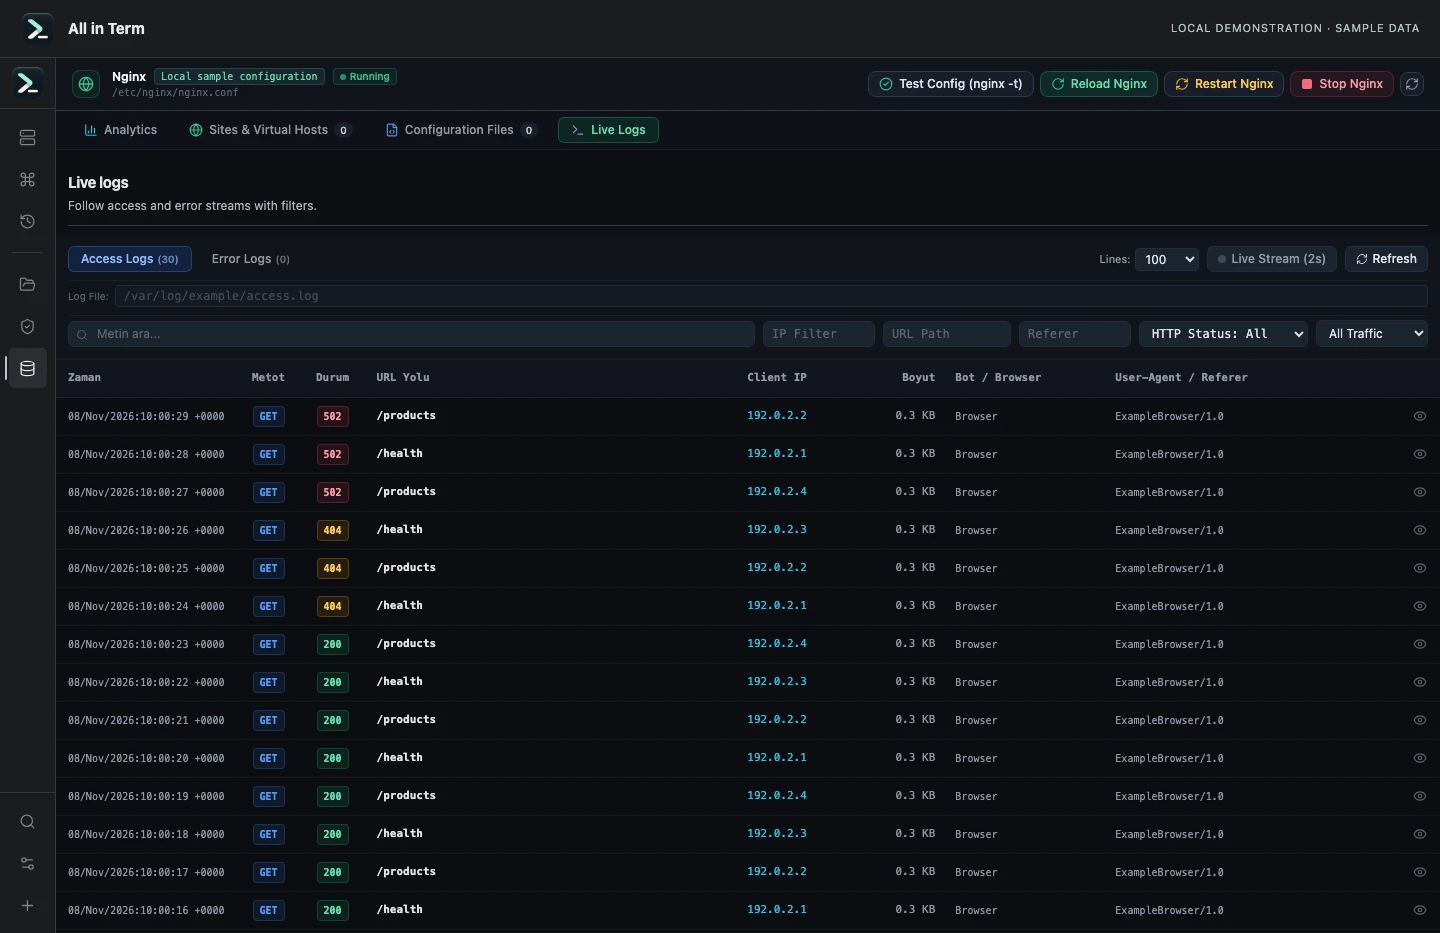
Nginx component displaying results parsed from 30 synthetic request records; no live Nginx server was inspected. Captured 2026-11-08. Open the image to inspect details.
Parse a known access-log fixture
Executed the current Nginx log parser against 30 synthetic access records and one synthetic error record. These counts describe only that fixture.
Executed check
parseRawNginxLogs(accessFixture, "access", examplePath)Recorded output
Parsed access records: 30
200 responses: 24
404 responses: 3
502 responses: 3
Parsed error records: 1
Recorded 2026-11-08. Executed locally against synthetic fixtures. No production host or database was contacted. Read the recorded checks.
A small command example
Read the comments, confirm the active host and adapt any example names to your environment before running commands.
# From an approved client: reproduce the failing read-only route.
curl -sS -o /dev/null -w 'public HTTP %{http_code}\n' https://shop.example.com/catalog
# From the proxy network context: substitute the configured HTTP target.
curl -sS -o /dev/null -w 'upstream HTTP %{http_code}\n' \
  --connect-timeout 3 --max-time 10 \
  -H 'Host: shop.example.com' http://127.0.0.1:8080/catalog
Further reading
Official documentation for the underlying tools. The workflows and synthetic examples above are editorial guidance, not performance claims.