A practical Linux server health check from your Mac
Investigate CPU, memory, disk, containers and services through a repeatable health check that connects metrics to symptoms.

A server health check should explain what needs attention and why. A high number alone is rarely enough: CPU may be busy doing useful work, memory may include reclaimable cache, and a disk can become operationally risky before it reaches a simple universal threshold. The task is to connect observed state with the service users depend on. This guide describes a focused review from a Mac using a connected server workspace. It covers resource pressure, processes, storage, listeners and containers, then turns the observations into a small maintenance plan. The example measurements are synthetic and do not describe a real host or product benchmark.
Start with a symptom and a baseline
Before opening a health panel, write down what prompted the check. Users might report slow responses, a scheduled job may have failed, or a monitoring alert may show low free space. Note the affected service, approximate start time and recent changes. If this is a routine review, record that too. A baseline review and an incident investigation can use similar tools while asking different questions about the same measurements.
Compare the current state with a normal period for that host whenever suitable history is available. A small server running a batch task may behave differently from a web gateway at its busiest hour. Avoid importing thresholds from an unrelated machine without understanding the workload. In All in Term, keep the active host visible while moving between performance, process and System Care views. The important connection is between the metric and the responsibility of that particular server.
Turn a metric into a justified decision.
- 01
Symptom
Name the affected service.
- 02
Signal
Read resource pressure in context.
- 03
Owner
Find the process, file or service.
- 04
Decision
Review an action and verify its effect.
Conceptual workflow · follow each check before moving to the next step.
Read CPU together with process behavior
If CPU activity is elevated, identify the processes using it and inspect their commands and owners. A known compression job, deployment build or data import can explain a short period of heavy work. A continuously restarting process may point to a different problem. The same percentage can represent useful progress or a loop that prevents useful work. Ask what changed and whether the service is meeting its expected response behavior.
Do not terminate a process merely because it appears at the top of a sorted list. Check its role and the consequences of stopping it. A database worker, backup process or container supervisor may be doing work that should finish or be stopped through a controlled service operation. Capture the relevant process identity and observation time before acting. This preserves evidence if the process disappears or restarts while you investigate the related service.
| Signal | Inspect | Avoid assuming |
|---|---|---|
| High CPU | Process command, workload and duration | The busiest process must be stopped |
| High memory use | Available memory, swap and accounting | All used memory is harmful |
| Low free disk space | Filesystem, directory growth, retention | Every large file is disposable |
| Unexpected listener | Owner, bind address and network controls | The port is publicly reachable |
Connect resource signals to the work that creates them.
The separate subsystems represent CPU, memory and disk observations. The lens represents investigation that connects those signals with a service and workload.
Read the context
A busy resource may reflect expected useful work. Compare the signal with symptoms, timing and the host's normal workload.
Find the owner
Inspect the responsible process, file or service before selecting an action. A high reading alone does not identify a remedy.
Distinguish memory use from memory pressure
Memory readings deserve context because operating systems use RAM for several purposes, including caches. A large used-memory number does not by itself establish that the host is struggling. Review available memory, swap behavior and the processes or containers consuming resources. Look for evidence that applications are slowing, allocations are failing or the system is repeatedly working to reclaim memory. The relevant signals depend on the operating system and the metrics exposed by your tools.
For containers, understand how the chosen interface calculates its memory display before comparing it with host totals. Different accounting views can include or exclude cache differently. Keep the measurement definition with the observation rather than treating every percentage as directly comparable. If a service grows steadily across repeated checks, investigate its workload and configuration. Clearing cache or restarting a process may change the number temporarily without resolving the underlying behavior that caused the investigation.

Find the work behind the number.
A busy process may be doing expected work. Inspect its command, owner and duration before deciding whether intervention is appropriate.
Concept illustration, not an application screenshot.Investigate storage before choosing cleanup
Check which filesystem is running out of space, then investigate the directories on that filesystem. A large archive under one mount does not necessarily explain pressure on another. Growth matters as well as current size: a log that expands rapidly may need attention even when some free space remains. Identify the owner and purpose of large files before selecting them for removal. A filename alone is not enough to determine whether a service still needs the content.
Use cleanup analysis to review candidates and estimated recoverable space. Follow the application's and operating system's normal retention processes for logs, package caches and data. Avoid deleting unfamiliar container storage or database files directly. The illustrative chart below assigns fictional storage sizes to broad categories to demonstrate prioritization. It is not a cleanup recommendation, and the categories are not all safe to remove. The next action should depend on ownership, retention and recovery needs.
Storage categories on a fictional server
Unit: GiB occupied. Synthetic example values, not production measurements.
Bars start at zero and share the same linear scale. Exact values are printed alongside each bar.
Connect listeners, services and containers
A listening port map helps connect a network endpoint with the process that owns it. Compare the bind address and port with the expected service configuration. A listener on a local address has a different context from one bound broadly, but network exposure also depends on firewalls, routing and other infrastructure. A local listener view alone cannot prove that the service is reachable from the public internet. Treat it as one piece of evidence.
For Docker workloads, inspect container state and recent logs alongside resource usage. A running container does not guarantee that the application inside is ready to serve requests. Check the intended service behavior and any configured health signal. If Compose definitions are available, review the relevant service configuration before changing lifecycle state. Restarting a container may be appropriate in some incidents, but it should follow a hypothesis and include a check that the original symptom improved.
Turn security findings into questions
A health review may surface risky SSH settings, failed services, unexpected startup commands or executables running from unusual locations. These observations deserve investigation, but a single signal is not proof of compromise. Preserve the evidence, identify the responsible account or service and compare it with expected administration activity. If you suspect an actual incident, follow the organization's incident process so that an improvised cleanup does not destroy useful evidence.
All in Term's read-only security findings are designed to support review. Keep that distinction clear when sharing a report: observed configuration, inferred risk and confirmed impact are different statements. Prioritize issues based on the service's role and the surrounding controls. A maintenance plan should explain what to inspect next and who owns the decision. Automatically applying a broad collection of fixes can create a new outage while making the original observation harder to explain.

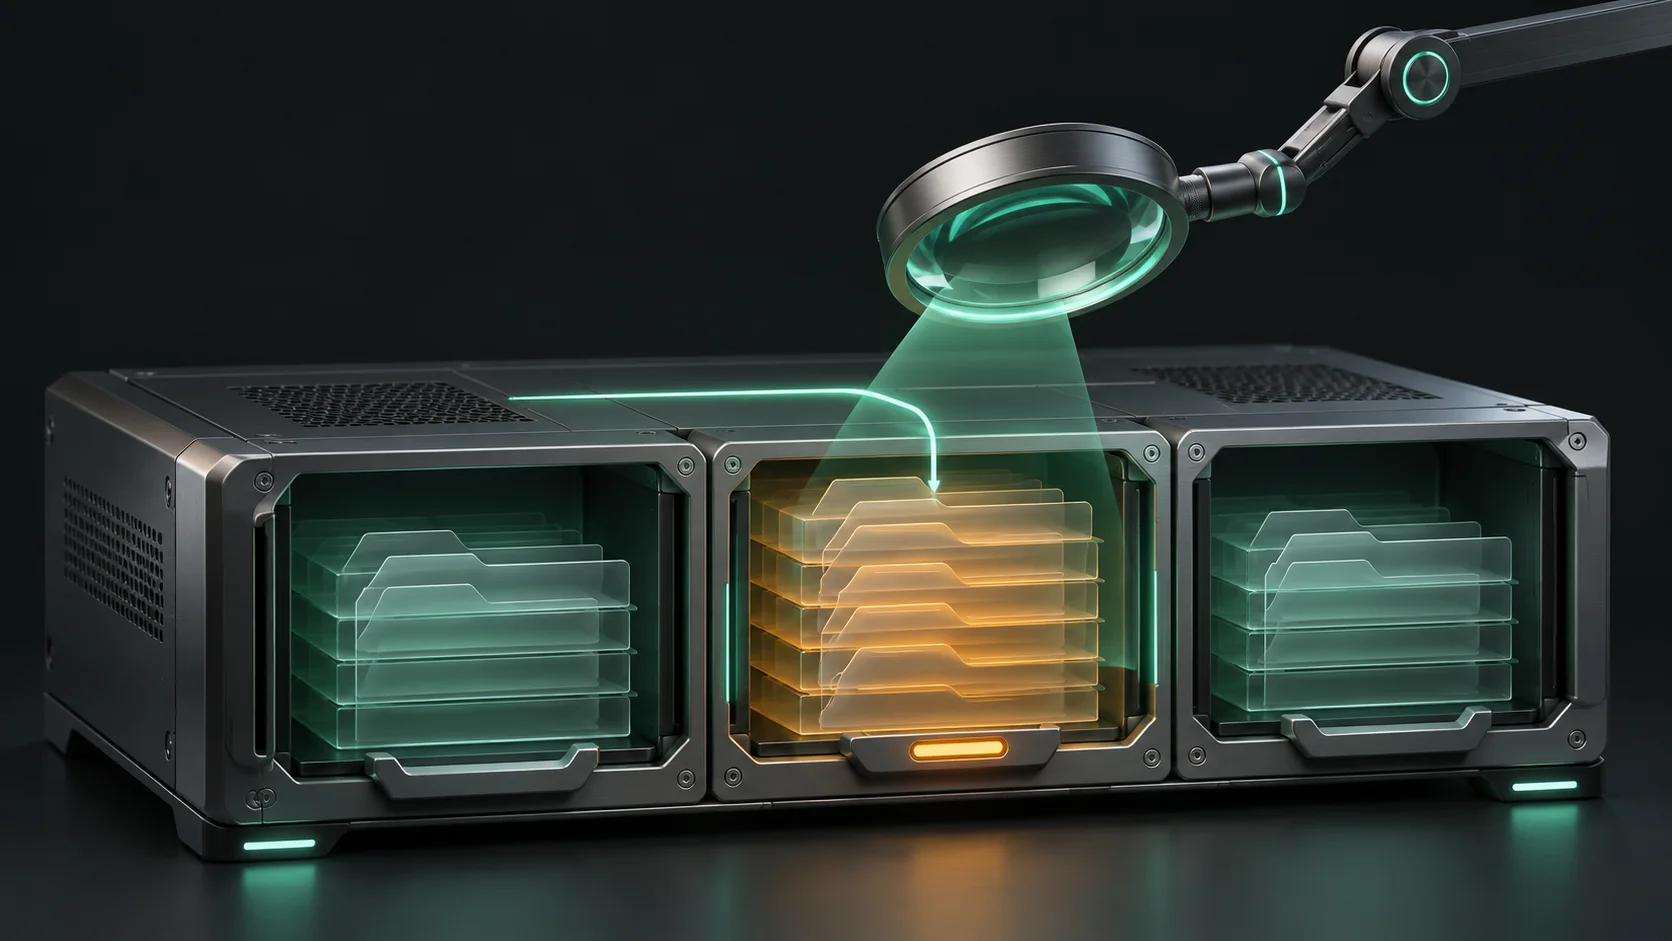
Review evidence before selecting maintenance.
The trays separate findings from actions. A highlighted item invites review; it does not indicate that deletion or a restart is automatically appropriate.
Keep findings explainable
Record the host, observation time and affected service so another operator can understand the evidence.
Act deliberately
Confirm ownership, retention and consequences before cleanup or service changes, then check the original symptom again.
Finish with a short maintenance record
End the review with a small list of findings, evidence and next actions. Include the host, time, affected service and any change performed. State which checks were read-only and which actions altered the environment. If no change was justified, record the observation and the condition that should trigger another check. This makes the report useful after the live metrics have moved on and the terminal session is no longer open.
For repeated care, choose a schedule that fits the workload and review execution logs. Scheduled activity should have a defined scope and an owner who understands its effects. A good health routine does not chase a perfect score; it helps keep the service understandable and reliable. Use the connected views in All in Term to follow the evidence from resource pressure to the responsible process, file or service, then verify that the chosen action addressed the real need.
Inside the application: a scoped local example
This capture uses the shipped UI component in an isolated renderer. The host, files and service data are demonstrations, not a production session. It illustrates the surrounding workflow; it does not verify every service-specific command in this guide.
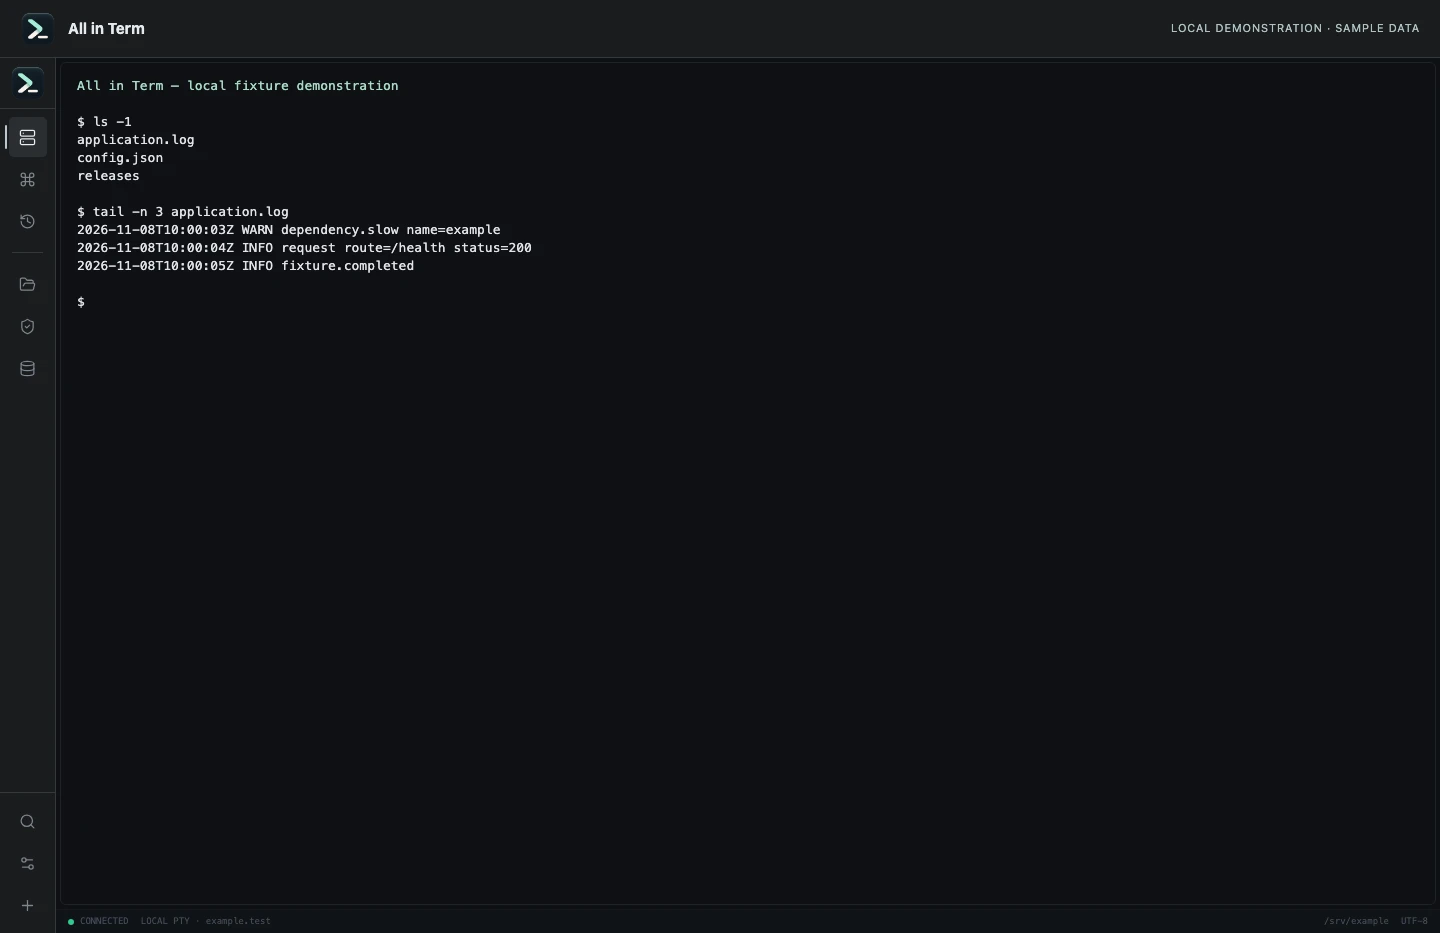
Local terminal view with command output recorded from an isolated temporary directory. Captured 2026-11-08. Open the image to inspect details.
List an isolated example directory
Executed /bin/ls against a newly created temporary directory.
Executed check
ls -1Recorded output
application.log
config.json
releases
Recorded 2026-11-08. Executed locally against synthetic fixtures. No production host or database was contacted. Read the recorded checks.
A small command example
Read the comments, confirm the active host and adapt any example names to your environment before running commands.
# Example read-only container checks
# Requires permission to access Docker
docker compose ps
docker compose logs --tail 50
docker stats --no-stream
Further reading
Official documentation for the underlying tools. The workflows and synthetic examples above are editorial guidance, not performance claims.