
Check Open Ports on Linux with ss and Test Remote Access
Check open ports on Linux with ss. Identify listening TCP sockets, inspect bind addresses and confirm reachability from a remote client.

A listening socket and a remotely reachable service are different observations. Start with ss on the Linux server, then test from the same network as the client that reports the problem. This guide separates bind address, process, protocol and reachability so an open-port investigation ends with evidence instead of an unnecessary firewall change.
Write down the endpoint you expect
Record the hostname, port and protocol the client uses. An HTTP health check may use TCP while another service on the same port number may use UDP. A hostname can point to several addresses or a proxy that terminates the request elsewhere. Record whether you are inspecting the public endpoint, a proxy's private upstream or a container. Use one known service and one read-only probe so the results have a clear meaning.
Write down who is expected to reach the service. A database used only by an application on the same host may need loopback reachability. An HTTP endpoint behind a reverse proxy may need to accept connections only from a private network. An externally published service may involve a load balancer that listens on a different port from the backend. Compare the expected access with the socket before changing configuration. A listener reachable by fewer networks can be the intended design.
Choose a check for the task
- 01
Listening locally
Check address, protocol and process
- 02
Reachable from client
Test the actual service protocol
- 03
Application responds
Verify the expected route and host
Conceptual workflow · follow each check before moving to the next step.
Start with the listener on the target
On Linux, ss -ltn shows listening TCP sockets using numeric addresses and ports. The process option can add process details when your account can see them. For UDP, inspect the relevant socket list separately and use a protocol-appropriate test. A loopback bind can be correct for a backend behind a local proxy. A wildcard address is broader, but network policy determines which clients can actually reach it. Check IPv4 and IPv6 separately when the symptom differs across clients.
When you find an unexpected process attached to the port, identify it through the process metadata you are authorized to inspect and compare it with the service definition. Do not assume its name tells you why it is running. Multiple replicas, socket activation, containers and service restarts can complicate the attribution. Capture the process identifier and time next to the exact bind address. If privileges limit the process details shown by ss, ask the service owner to verify the mapping from their environment.
| Option or symptom | What to look for | Where to start |
|---|---|---|
| Listening locally | ss shows a socket | Check address, protocol and process |
| Reachable from client | TCP connection succeeds | Test the actual service protocol |
| Application responds | HTTP status and body match | Verify the expected route and host |
Linux listener and firewall
Observe which process listens on the expected address and port.
Workflow
Check address, protocol and process
Check the process and network namespace
If the expected listener is missing, identify where the service runs. It might be in a container or another network namespace instead of the host shell you are using. Compare its application bind address and its published port if one is configured. Then check service state and recent logs for exits or configuration errors. A restart can destroy useful evidence, so record the timestamp and observed address before applying a repair.
Make the client probe match the service protocol. A successful TCP connection does not prove that an HTTP request used the right virtual host, returned the expected status or completed authentication. Check a harmless route with the correct hostname and scheme. For encrypted services, include the intended hostname so the client can check the certificate and the server can select the expected virtual host. If a probe times out, note whether it failed while connecting or after sending the request.
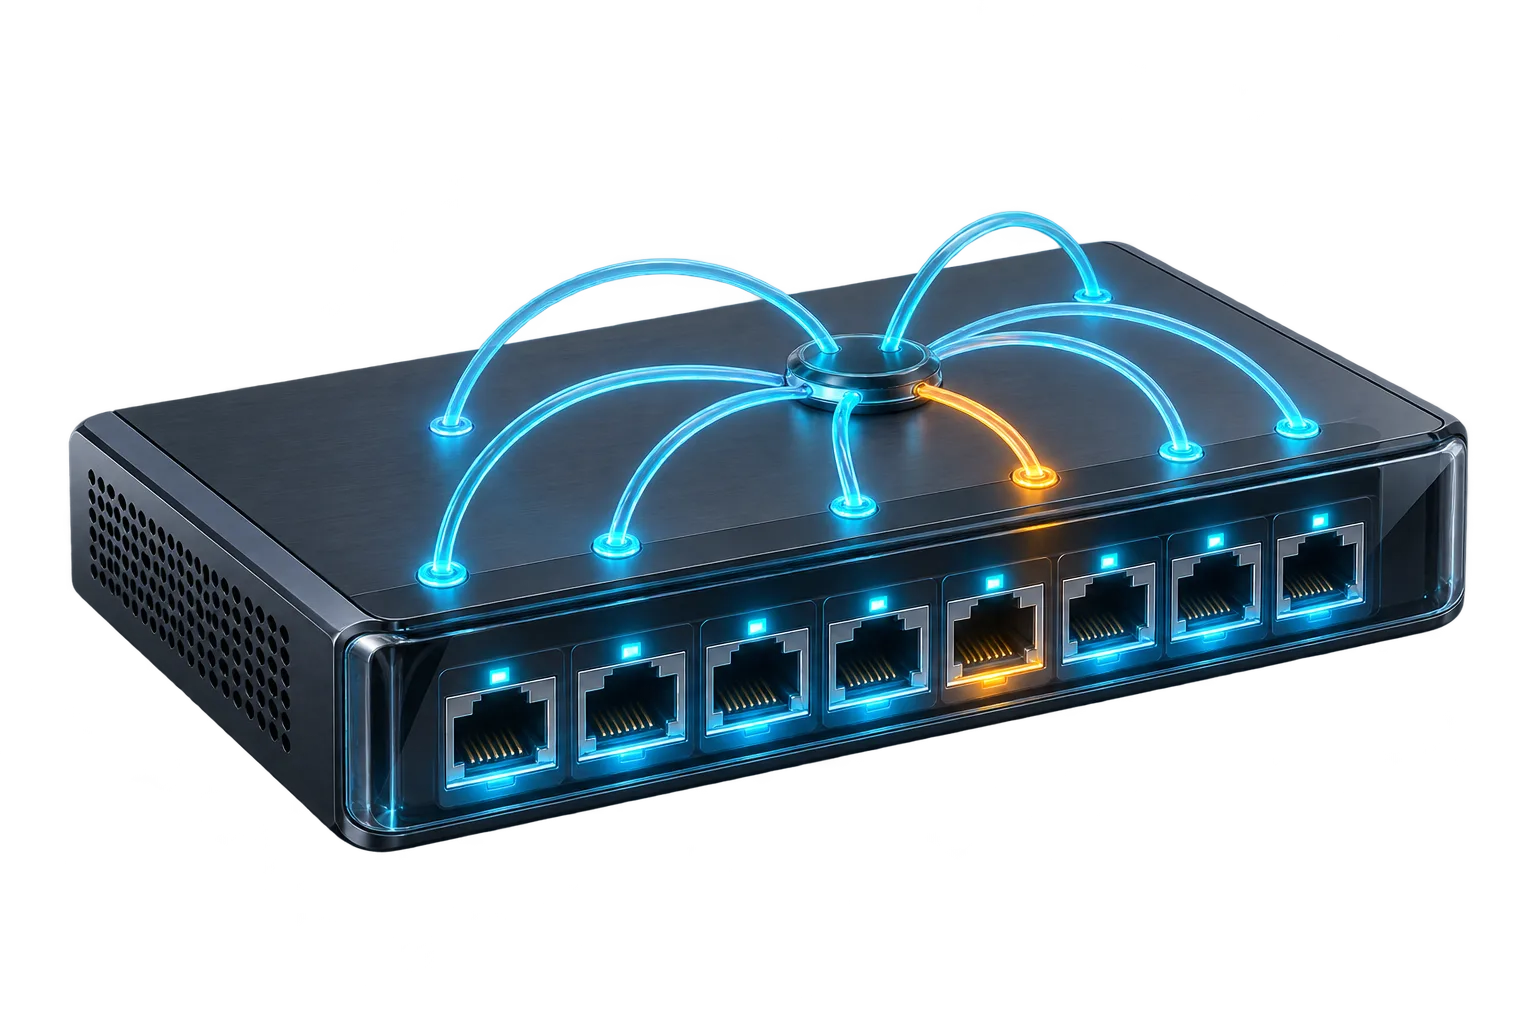
Linux listener and firewall
Observe which process listens on the expected address and port.
Concept illustration, not an application screenshot.Distinguish local success from remote reachability
A successful request to 127.0.0.1 confirms only that the test reached that local endpoint. Repeat with the endpoint and route the affected client uses. A refused TCP connection and a timeout suggest different next checks, but neither alone identifies a specific firewall rule. Review DNS, routes and the appropriate host or network policy. Probe only hosts you are authorized to inspect and choose bounded connection times for repeatable results.
Reachability across three sample checkpoints
Unit: endpoints. Synthetic example values, not production measurements.
Bars start at zero and share the same linear scale. Exact values are printed alongside each bar.

Loopback and external network paths
Compare loopback and external reachability against the intended network policy.
Workflow
Test the actual service protocol
Read the example from inside to outside
The chart shows eight fictional endpoints with local listeners, six responding from a neighboring host, and four responding through the intended edge. The counts describe a training scenario with the same endpoints at each stage. For a real investigation, identify each endpoint by name and match the failed probe with its expected policy. Some services are deliberately private. A low public count can be correct when only the edge should accept external traffic.
For a reusable incident note, include the endpoint the user tried, the IP address you tested, the place you ran the probe from and the listener you observed. Note any proxy or network namespace between those points. This is enough information for a teammate to repeat the test from a second vantage point. If a reviewed repair changes a listener or network rule, confirm access for the intended client and preserve the expected restrictions for other networks. Capture a fresh result from the original network after the change.
Four of eight example endpoints respond through the edge, or 50 percent. Two endpoints drop out between the local and neighbor checks and two more between neighbor and edge. Treat those differences as prompts to examine reachability at each stage. You need each endpoint's expected access policy before deciding whether a particular missing response is evidence of a problem.
Capture findings and run the same probe again
Try this example with a web process that listens on loopback at port 8080. A reverse proxy on the same Linux host sends requests there and exposes a public HTTPS endpoint on 443. The expected result is that the local probe to 8080 succeeds and that external clients use 443. If a browser cannot connect directly to public port 8080, compare its request with the intended architecture before opening the port. The actual defect could be a bad URL in a setup note. If the public 443 request fails instead, observe the edge listener and inspect what the proxy records when it attempts the local request. Separate those two observations in your notes. They show which part of the path deserves inspection and which part already operates as designed.
All in Term can keep the remote terminal beside other host inspection tools so you can match listener output with the relevant process or service context. Start with one approved staging host. Compare the listener inventory with one client probe and document the exact endpoint. Download the app if you want to keep those checks and remote files in a single Mac workspace. After a change, retest from the same network and record the result.

Connection from a remote client
Repeat the protocol probe from the affected client network.
Workflow
Verify the expected route and host
Inside the application: a scoped local example
This capture uses the shipped UI component in an isolated renderer. The host, files and service data are demonstrations, not a production session. It illustrates the surrounding workflow; it does not verify every service-specific command in this guide.
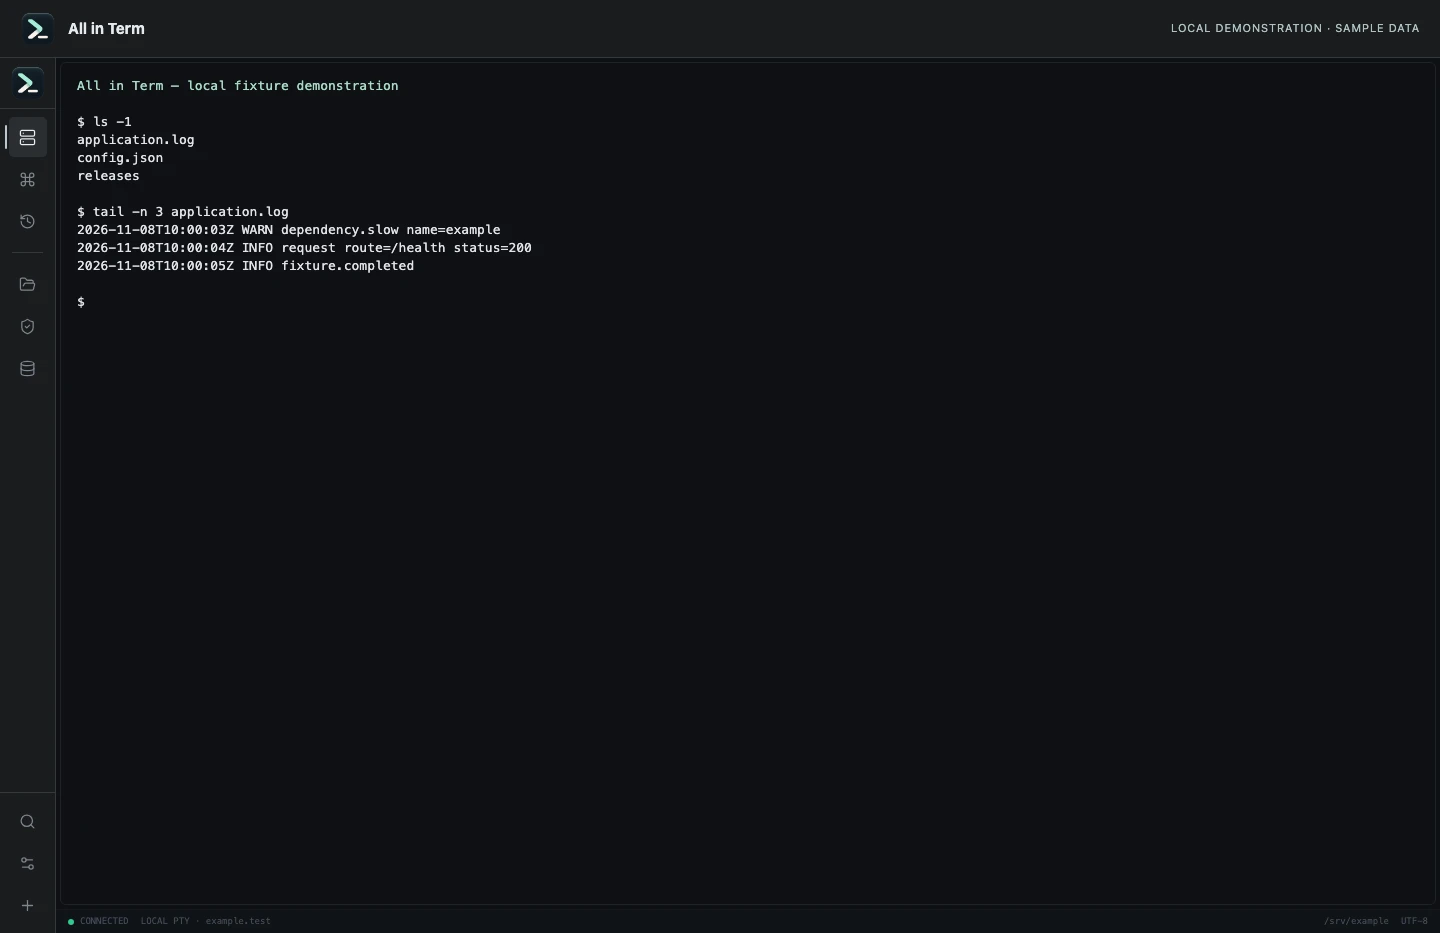
Local terminal view with command output recorded from an isolated temporary directory. Captured 2026-11-08. Open the image to inspect details.
List an isolated example directory
Executed /bin/ls against a newly created temporary directory.
Executed check
ls -1Recorded output
application.log
config.json
releases
Recorded 2026-11-08. Executed locally against synthetic fixtures. No production host or database was contacted. Read the recorded checks.
A small command example
Read the comments, confirm the active host and adapt any example names to your environment before running commands.
ss -ltnp
ss -lunp
# Substitute an approved HTTP endpoint.
curl --connect-timeout 3 --max-time 8 http://127.0.0.1:8080/health
Further reading
Official documentation for the underlying tools. The workflows and synthetic examples above are editorial guidance, not performance claims.