Filter Docker Compose logs by service, time and replica
Use docker compose logs with --since, --tail, --timestamps, --follow and --index to isolate service output and compare replicas.
When a Compose project has an API, workers and several dependencies, a full log dump can bury the first useful error. Start with a service and a time window, then add related services as the investigation develops. This guide shows how to inspect recent output, follow a live test and separate replicas. It assumes a Compose project you are authorized to inspect and uses api and worker as example service names.
Confirm the project before reading its logs
Run the command from the intended project directory or provide the same Compose configuration and project selection used by the deployment. Check the Docker context too. A laptop can be configured to talk to a remote daemon, and a familiar directory name does not guarantee that the active target is the one you mean. Use docker compose ps to identify the running or exited containers associated with the project, and compare those details with the service you are investigating.
Pick the user action you want to explain. An HTTP error, missing background result or unusually slow job gives you a concrete time and a service to start with. Write down the approximate time and timezone. If you have a request or job identifier, record that as well. A wide search for the word error can find several unrelated issues. The relevant question is whether a particular message explains what happened to the specific request.
From the first check to verification
- 01
Select
Confirm the Docker context and project.
- 02
Scope
Choose a service and time window.
- 03
Follow
Reproduce one safe request.
- 04
Correlate
Match the event across services.
Conceptual workflow · follow each check before moving to the next step.
Read a bounded window first
Use the service name as an argument to docker compose logs. Add timestamps and choose a recent window with --since. A limit with --tail controls how many lines from the end of each container's output you see. If the service is busy, a narrow tail can omit the event you are looking for even when it falls inside the chosen time window. Adjust the bounds deliberately and label any excerpt with the options used to obtain it.
When comparing two services after a deployment, use the same explicit time range when feasible. An absolute timestamp with a timezone makes a saved command easier to interpret later than a relative window that changes every time it runs. Keep the service or container prefix visible when viewing combined output. It identifies which component wrote each line. A database timeout in a worker and the same words in an API process may indicate distinct stages of one request.
| Item | What it tells you | Example or next step |
|---|---|---|
| Service argument | Limit output to named services | api worker |
| --since / --until | Bound the selected time period | Absolute time with timezone |
| --tail | Limit output per container | --tail 100 |
| --index | Choose one replica of a service | --index 1 api |
| --follow | Continue reading new output | Stop when the test is captured |
Choose the service that observed the symptom.
Start with one service before widening the search to dependencies or replicas.
Select
Confirm the Docker context and project.
Scope
Choose a service and time window.
Follow one reproduction live
After the initial inspection, open a follow session with a small tail. Leave that terminal visible and trigger a safe reproduction from another terminal or the application. Capture the time and result of the request as well as the logs. If the reproduction generates no matching messages, check whether the request reached the service, whether you selected the right container, and whether the application writes the relevant events to the output captured by Docker.
Stop the follow session when you have the needed evidence. Following indefinitely during an investigation can bury the interesting lines under later traffic. Save a small excerpt with a few lines of context on either side and remove sensitive values before sharing it. Logs can contain URLs, tokens, account identifiers and request bodies. A narrow excerpt tied to a specific question can be more useful to a teammate than a large export with little context.
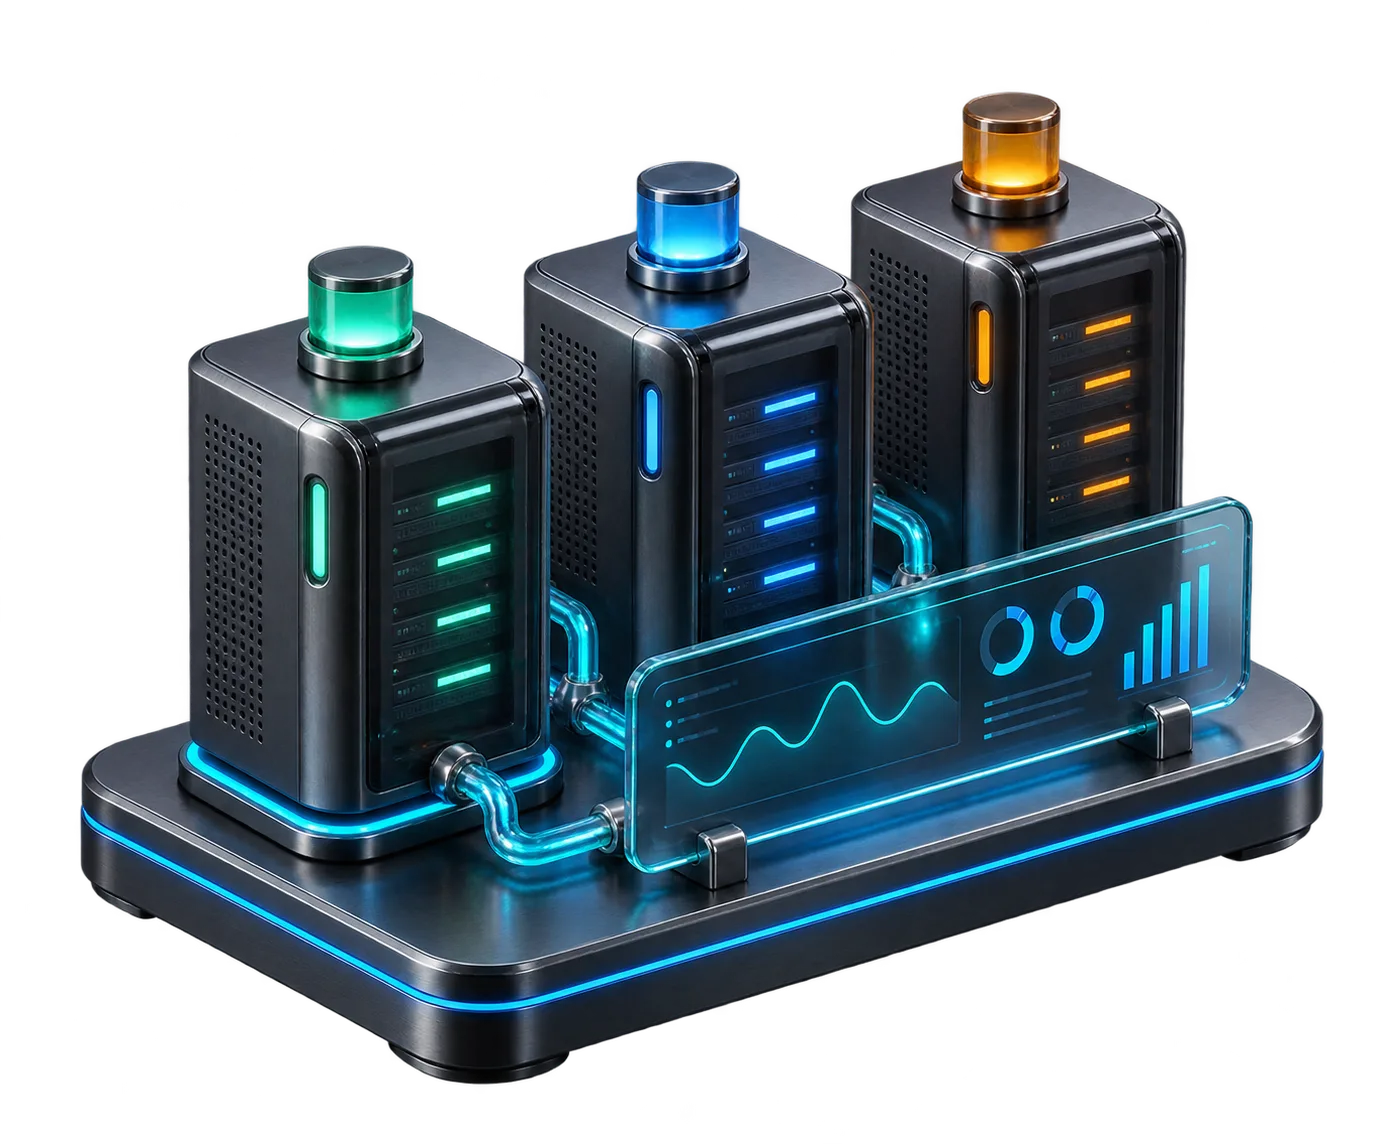
Follow the request across services.
Keep service names visible and use a request or job identifier when one is available.
Concept illustration, not an application screenshot.Separate replicas and dependent services
A single service can run several containers. If an error occurs intermittently, inspect the service prefix and correlate each failure with the replica that emitted it. Docker Compose also provides an index option for selecting a replica. Confirm the mapping in the active project before concluding that a particular instance is unhealthy. A recreated container may be associated with a different period of deployment history than another replica that has been running longer.
Follow the request across components using a common identifier if the application provides one. An API can accept a job successfully while a worker fails later. Begin with the component that observed the symptom, then check the component it called. Compare timestamps, but allow for clocks, logging delays and different time formats. If the records do not include a shared identifier, keep the connection between events as a hypothesis until a focused reproduction or another observation supports it.
The chart depicts total log lines in a fictional window. A noisy replica may simply be handling more traffic or using more verbose logging. Review the request identifiers and error messages before drawing a conclusion about health. The count helps decide where to look first.
Log entries in a fictional incident window
Unit: lines. Synthetic example values, not production measurements.
Bars start at zero and share the same linear scale. Exact values are printed alongside each bar.
Investigate a missing log as a separate question
Compose reads output Docker makes available for the selected containers. Some applications write mainly to files inside a container or mounted volume. Some deployments send output through a logging driver with its own retention behavior. If the lines you expect are absent, confirm where the application writes them, how the daemon captures them and whether they are still retained. Checking a recent visible event against the logging configuration is a useful first step.
When working from your Mac, All in Term can keep a remote shell open beside remote file views. Use the shell for Compose output and use file follow for a readable log stored on the host when that is where the application writes. Keep track of which stream you are reading. A remote file follower and docker compose logs observe different sources, so an empty view in one place should lead you to check the logging path before assuming the application was silent.
Capture enough evidence to verify a repair
Make a short note of the project, service, replica if relevant, time range and request identifier. Add the first relevant error and the action that reproduced it. Decide what a successful repeat should look like. For example, an API should return the expected response and its corresponding worker should complete the job with the same identifier. A changed message on its own may only show that the request reached another stage.
After a reviewed fix, repeat the same request with the same service selection and a fresh time window. Confirm the user-visible result and look for expected supporting events. When the error was rare, gather several comparable observations before declaring the problem resolved. Retain the small command set that isolated the issue so a teammate can rerun it without reconstructing your whole terminal history. Include any logs that were unavailable and where you looked for them. That record helps someone distinguish missing evidence from a check that confirmed normal behavior.
Find the log source your application uses.
Check whether the application writes to captured container output or to a file on disk.
Follow
Reproduce one safe request.
Correlate
Match the event across services.
Inside the application: a scoped local example
This capture uses the shipped UI component in an isolated renderer. The host, files and service data are demonstrations, not a production session. It illustrates the surrounding workflow; it does not verify every service-specific command in this guide.
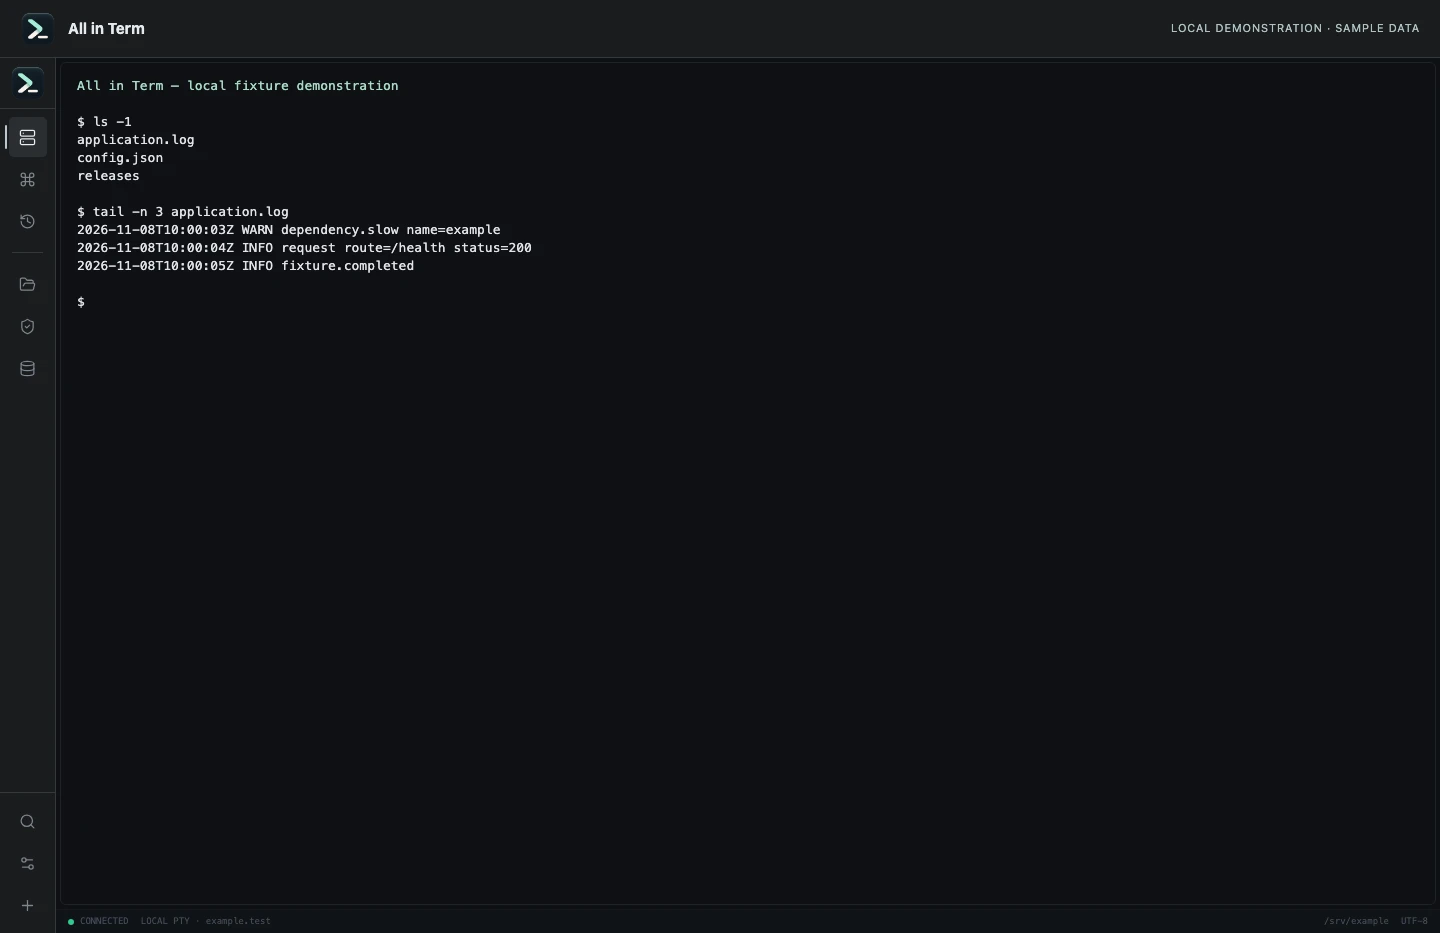
Local terminal view with command output recorded from an isolated temporary directory. Captured 2026-11-08. Open the image to inspect details.
List an isolated example directory
Executed /bin/ls against a newly created temporary directory.
Executed check
ls -1Recorded output
application.log
config.json
releases
Recorded 2026-11-08. Executed locally against synthetic fixtures. No production host or database was contacted. Read the recorded checks.
A small command example
Read the comments, confirm the active host and adapt any example names to your environment before running commands.
# From the Compose project directory, replace api and worker as needed.
docker context show
docker compose ps
docker compose logs --since 15m --tail 100 --timestamps api worker
docker compose logs --since 15m --timestamps --index 1 api
docker compose logs --follow --tail 30 --timestamps api
Further reading
Official documentation for the underlying tools. The workflows and synthetic examples above are editorial guidance, not performance claims.